~/paperplothub · for global researchers
Reproduce the plot.
Reuse the craft.
A living reference shelf for high-value paper figure reproductions, built for global researchers writing better papers.
收集真实论文中的高质量图表复现脚本,让研究者在写论文、复现实验和打磨可视化时, 能更快找到可参考、可运行、可复用的例子。也欢迎贡献你的复现脚本,一起把这个库做得更有用。
// Open marketplace for academic paper plot scripts
27
approved
21
papers
14
types
{
  "queue":        0        // waiting review
  "views":        8,350    // researcher reads
  "downloads":    0        // script reuse
  "mission":      "better plots for better papers"
}
$ watch global research pulse --timezone local
local researcher pulse
--:--
detecting timezone
UTC
detecting locale
activating...
ls /chart-types
// matplotlib taxonomy · 14 categoriesBar Chart
柱状图
matplotlib.pyplot.bar / barh
Histogram
直方图 / 频次分布
plt.hist
Line Chart
折线图
plt.plot / step
Scatter Plot
散点图
plt.scatter
Area / Stack
面积图 / 堆叠图
stackplot / fill_between
Box / Violin
箱线图 / 小提琴图
boxplot / violinplot
Heatmap
热力图 / 矩阵图
imshow / pcolormesh
Contour
等高线图
contour / contourf
Radar / Polar
雷达图 / 极坐标
polar projection
Pie / Donut
饼图 / 环形图
plt.pie
Error Bar
误差棒图
plt.errorbar
3D Plot
三维图
mpl_toolkits.mplot3d
Table
表格
plt.table / pandas
Other
其他
custom or hybrid figures
cat plots/recent.json | head -30
27 approved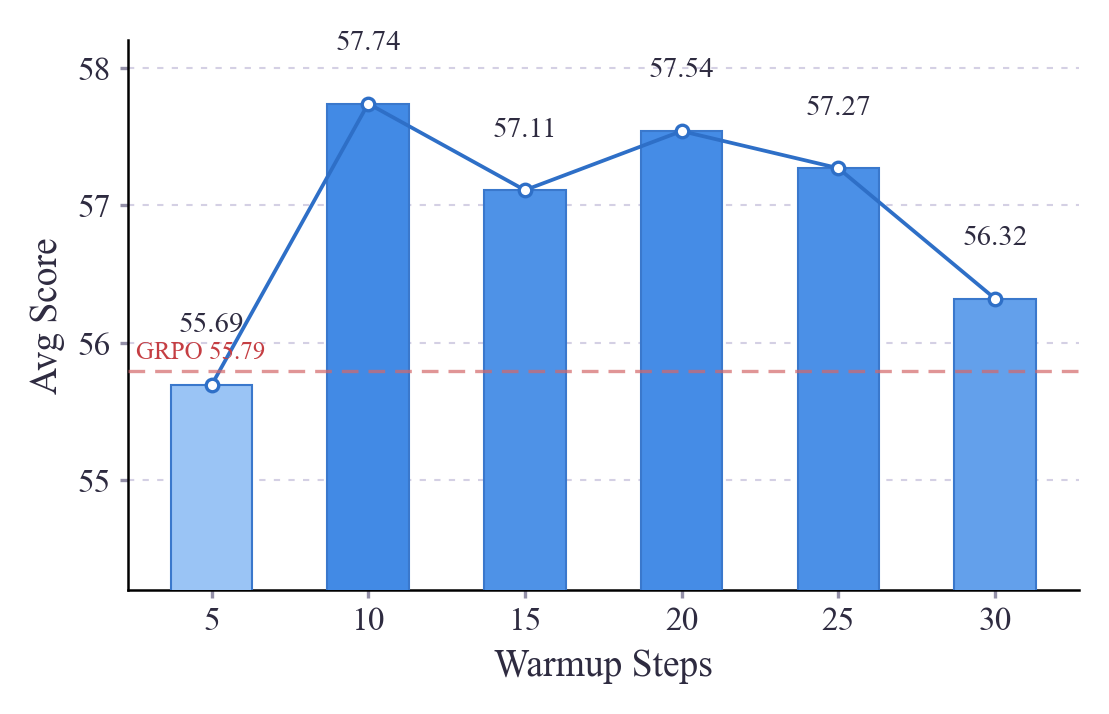 average_scores_across_warmup_steps.pyBar Chart柱状图
Average Scores Across Warmup Steps
不同预热步骤的平均分
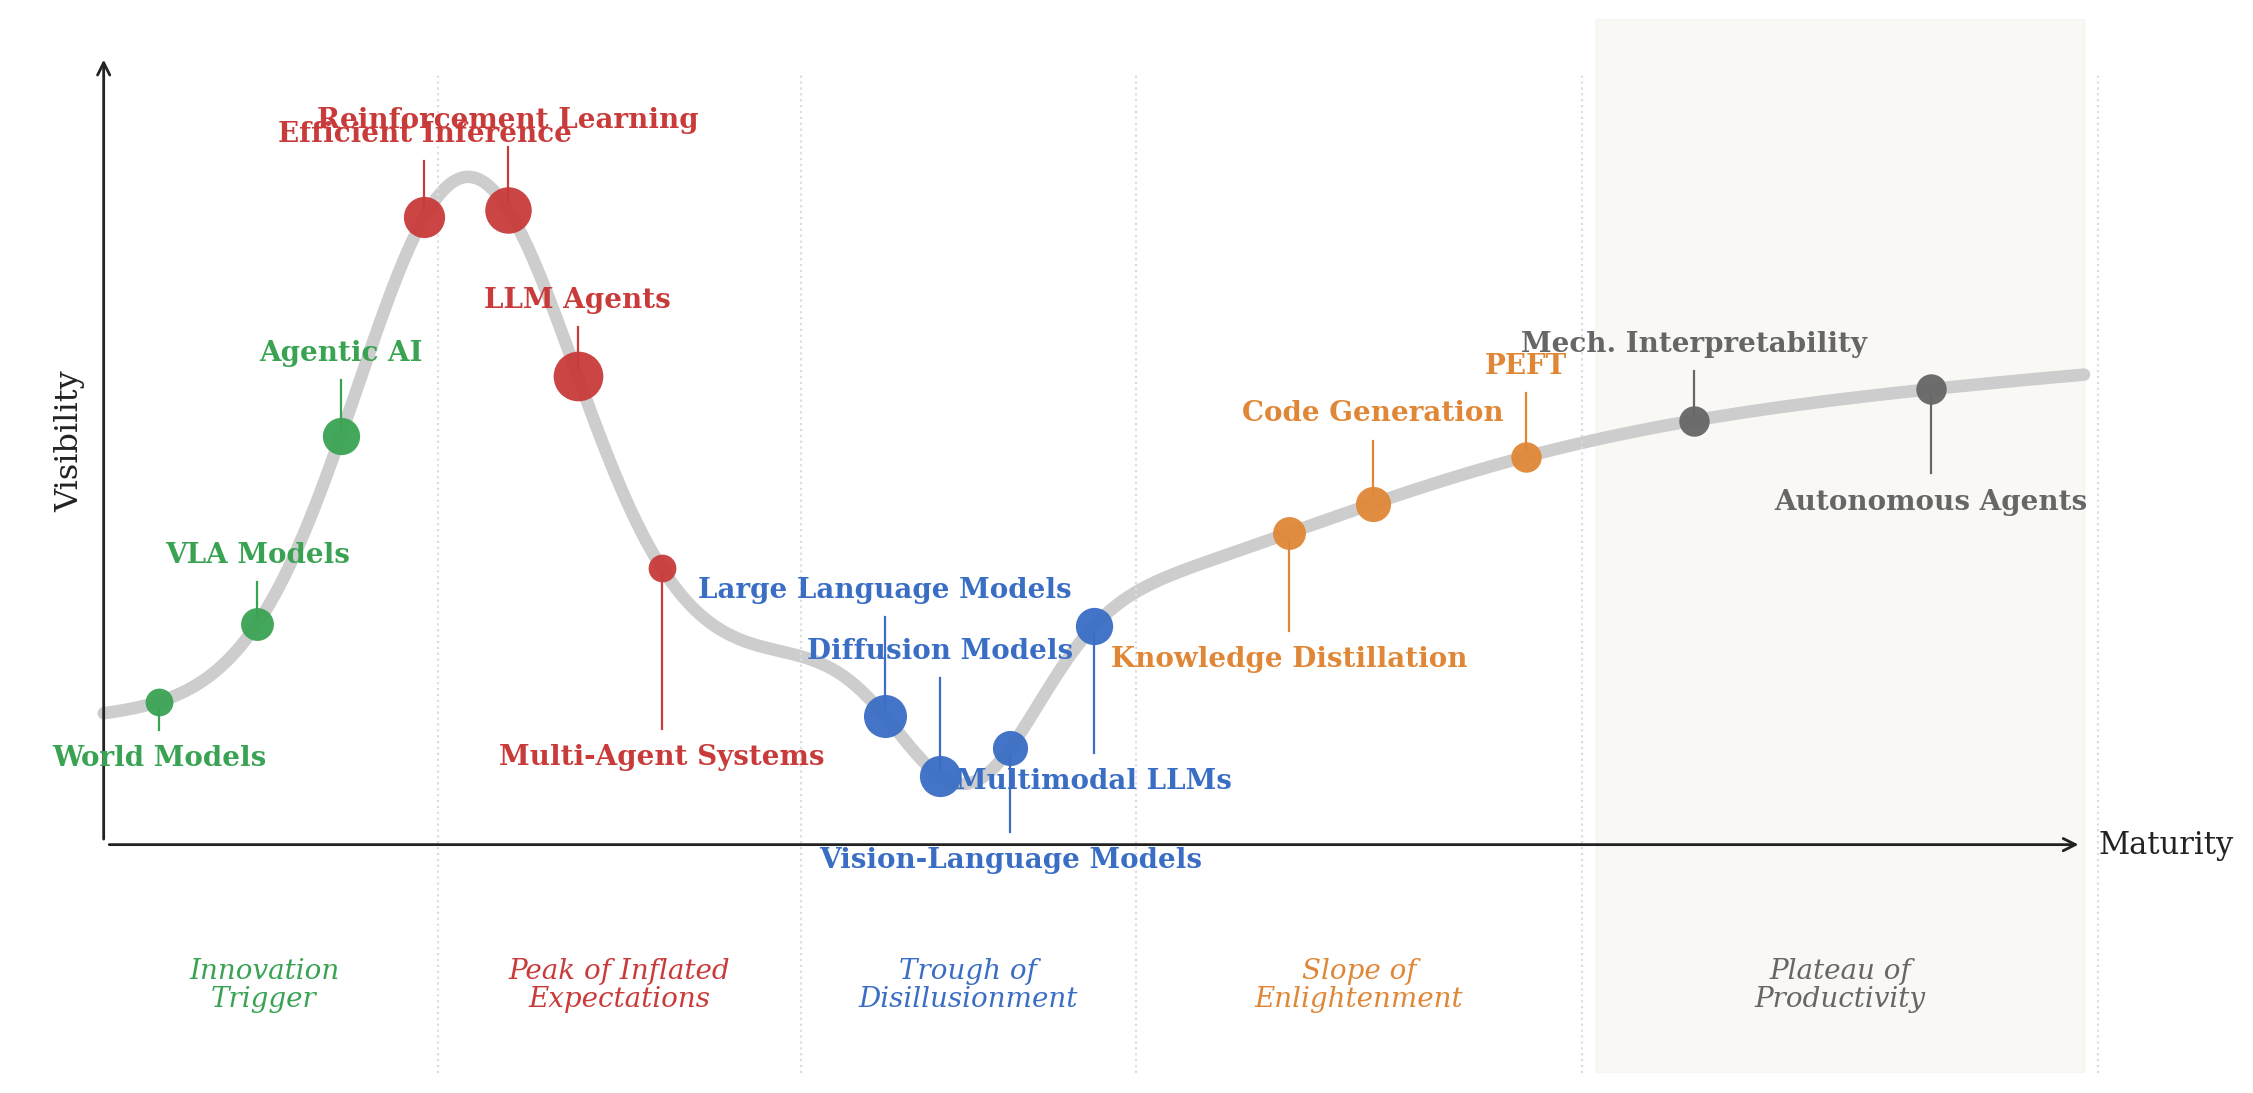 paperespresso_hype.pyOther其他
Paper-Espresso · AI research hype-cycle (Gartner-style) chart
Paper-Espresso · AI 研究 Gartner 风格 Hype-Cycle 曲线
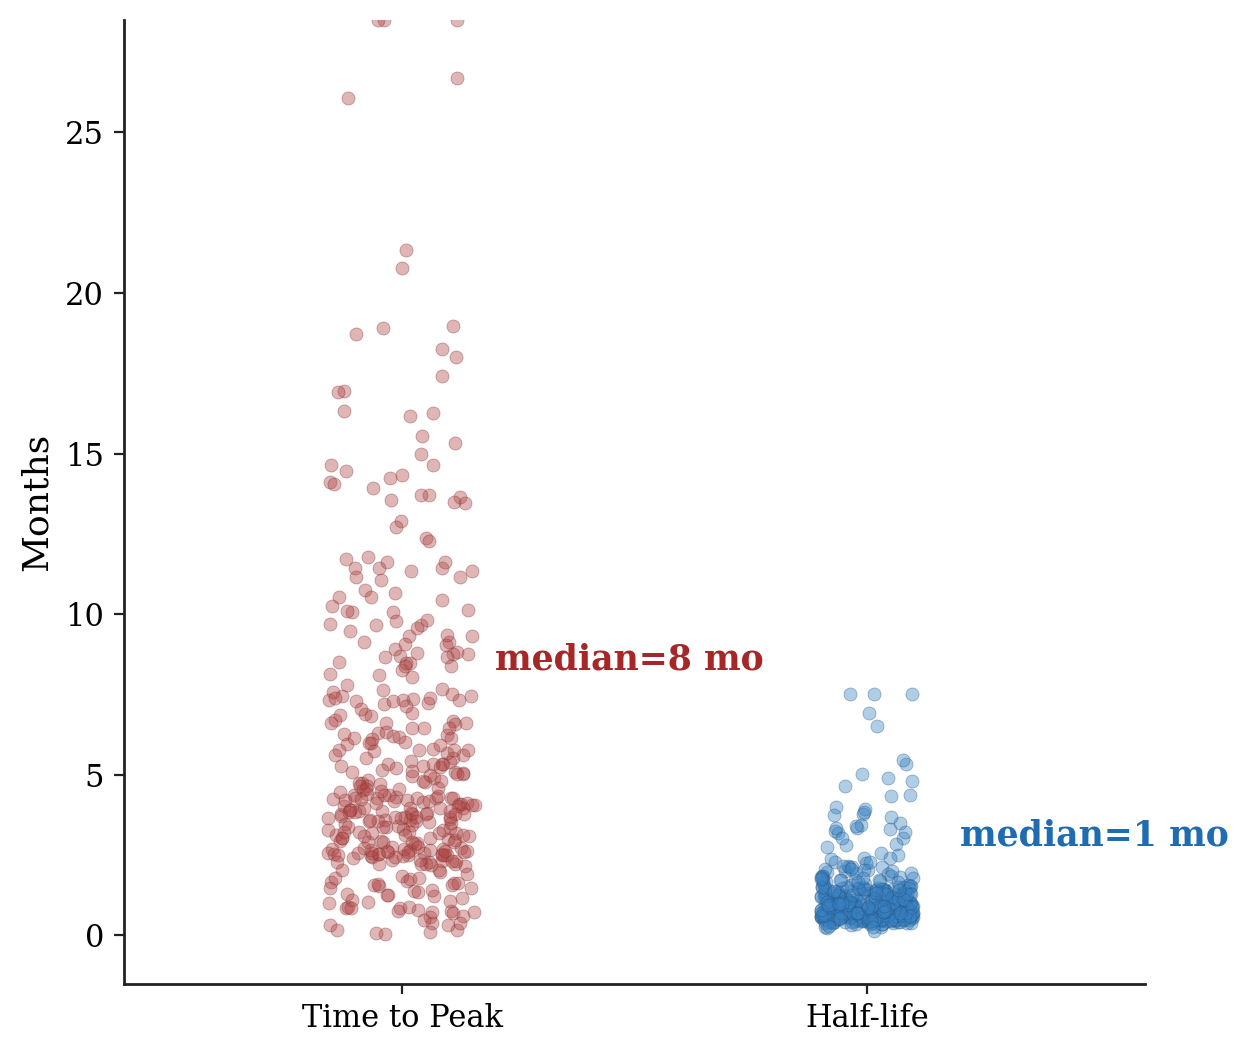 paperespresso_swarm.pyBox / Violin箱线图 / 小提琴图
Paper-Espresso · Strip plot of topic time-to-peak vs half-life
Paper-Espresso · 话题 Time-to-Peak 与 Half-life 的散点带图
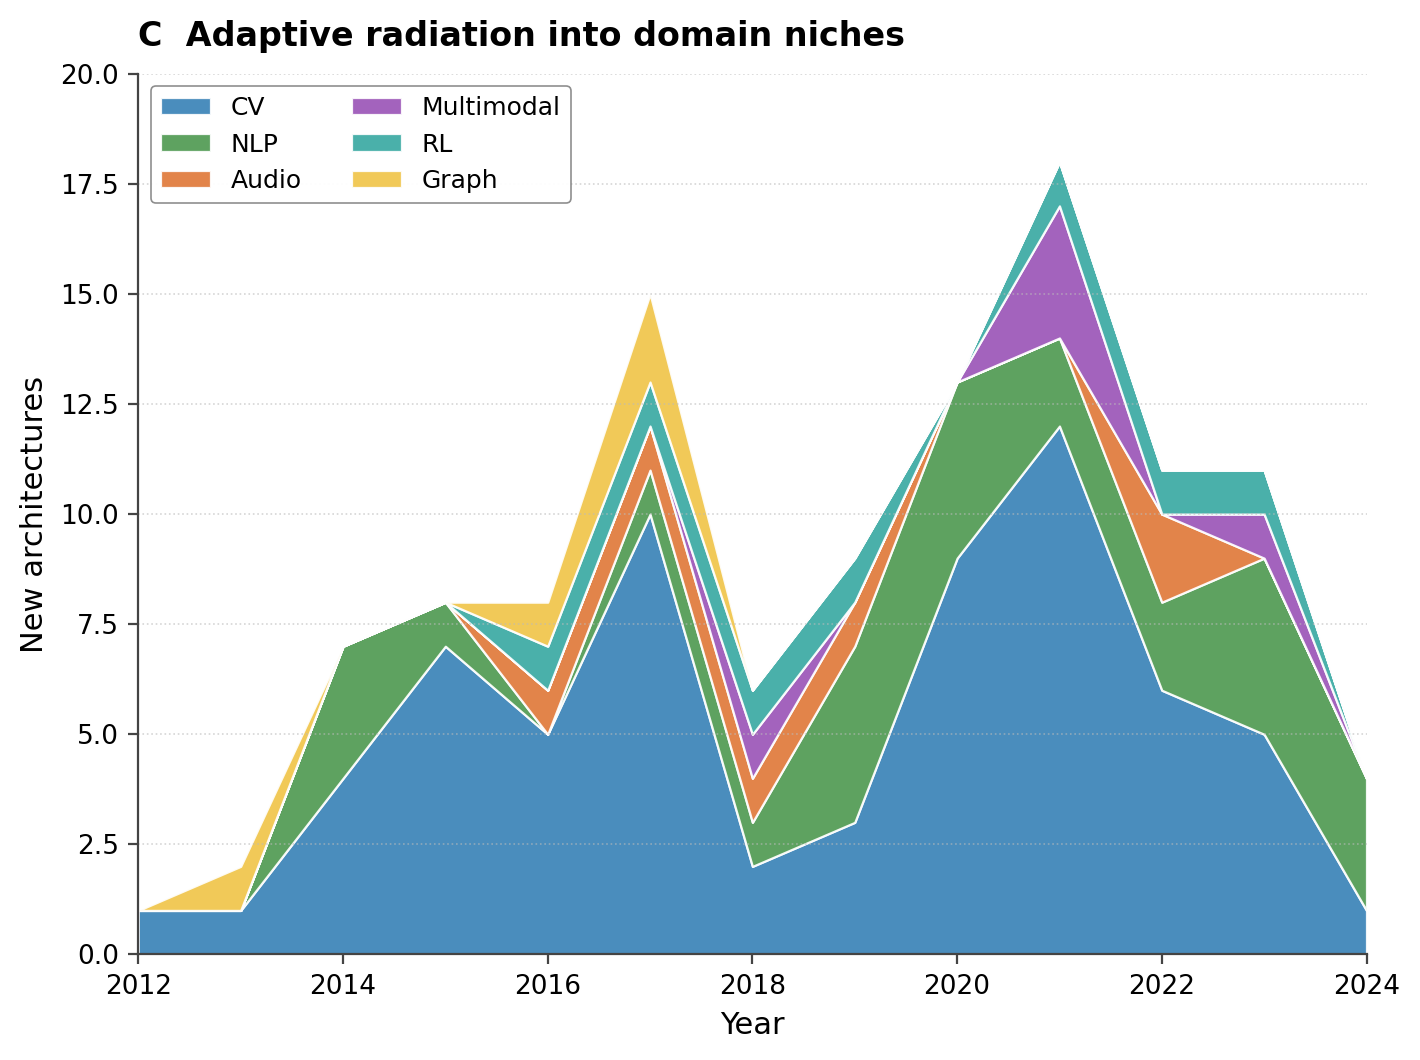 aievol_diversification.pyArea / Stack面积图 / 堆叠图
AI-Evolution · Stacked area of new architectures by year and domain
AI-Evolution · 各域逐年新架构数堆叠面积图
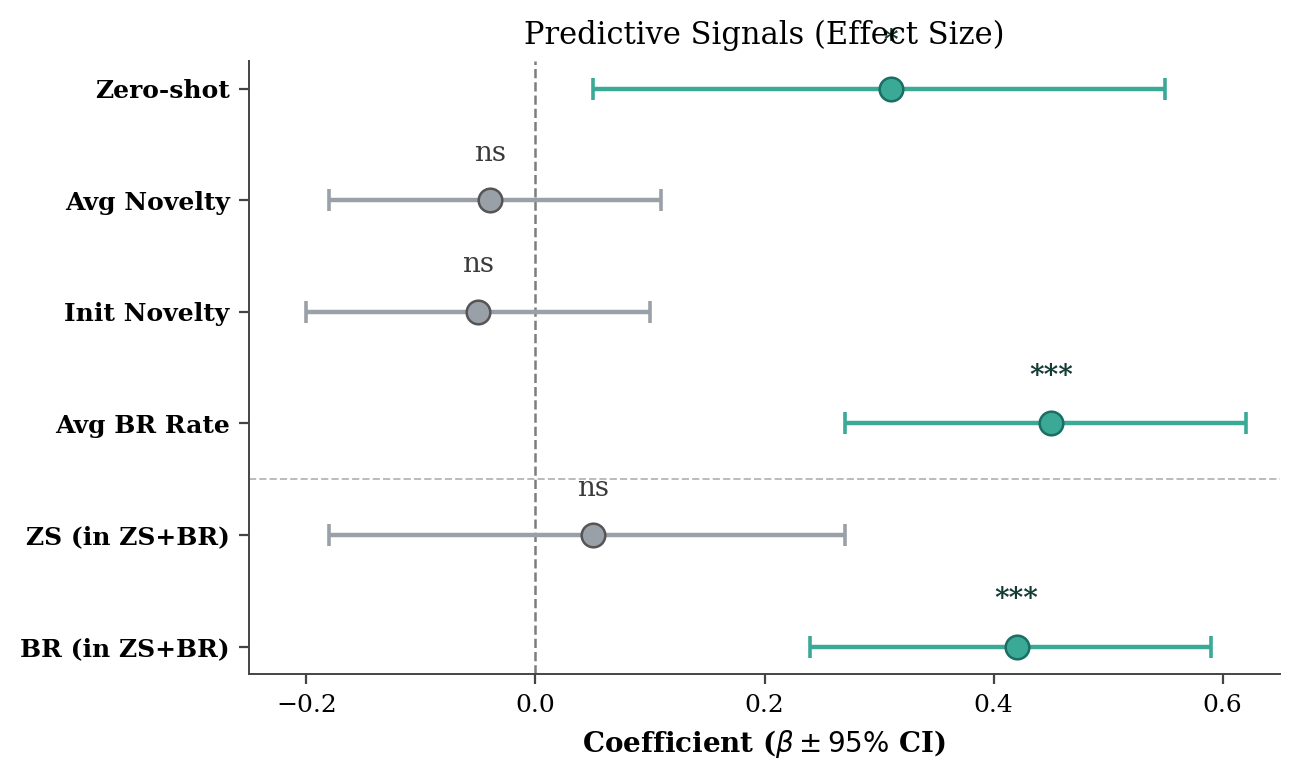 llmoptim_forest.pyError Bar误差棒图
LLM-Evol-Optim · OLS forest plot with confidence intervals
LLM-Evol-Optim · OLS 系数森林图(带 95% 置信区间)
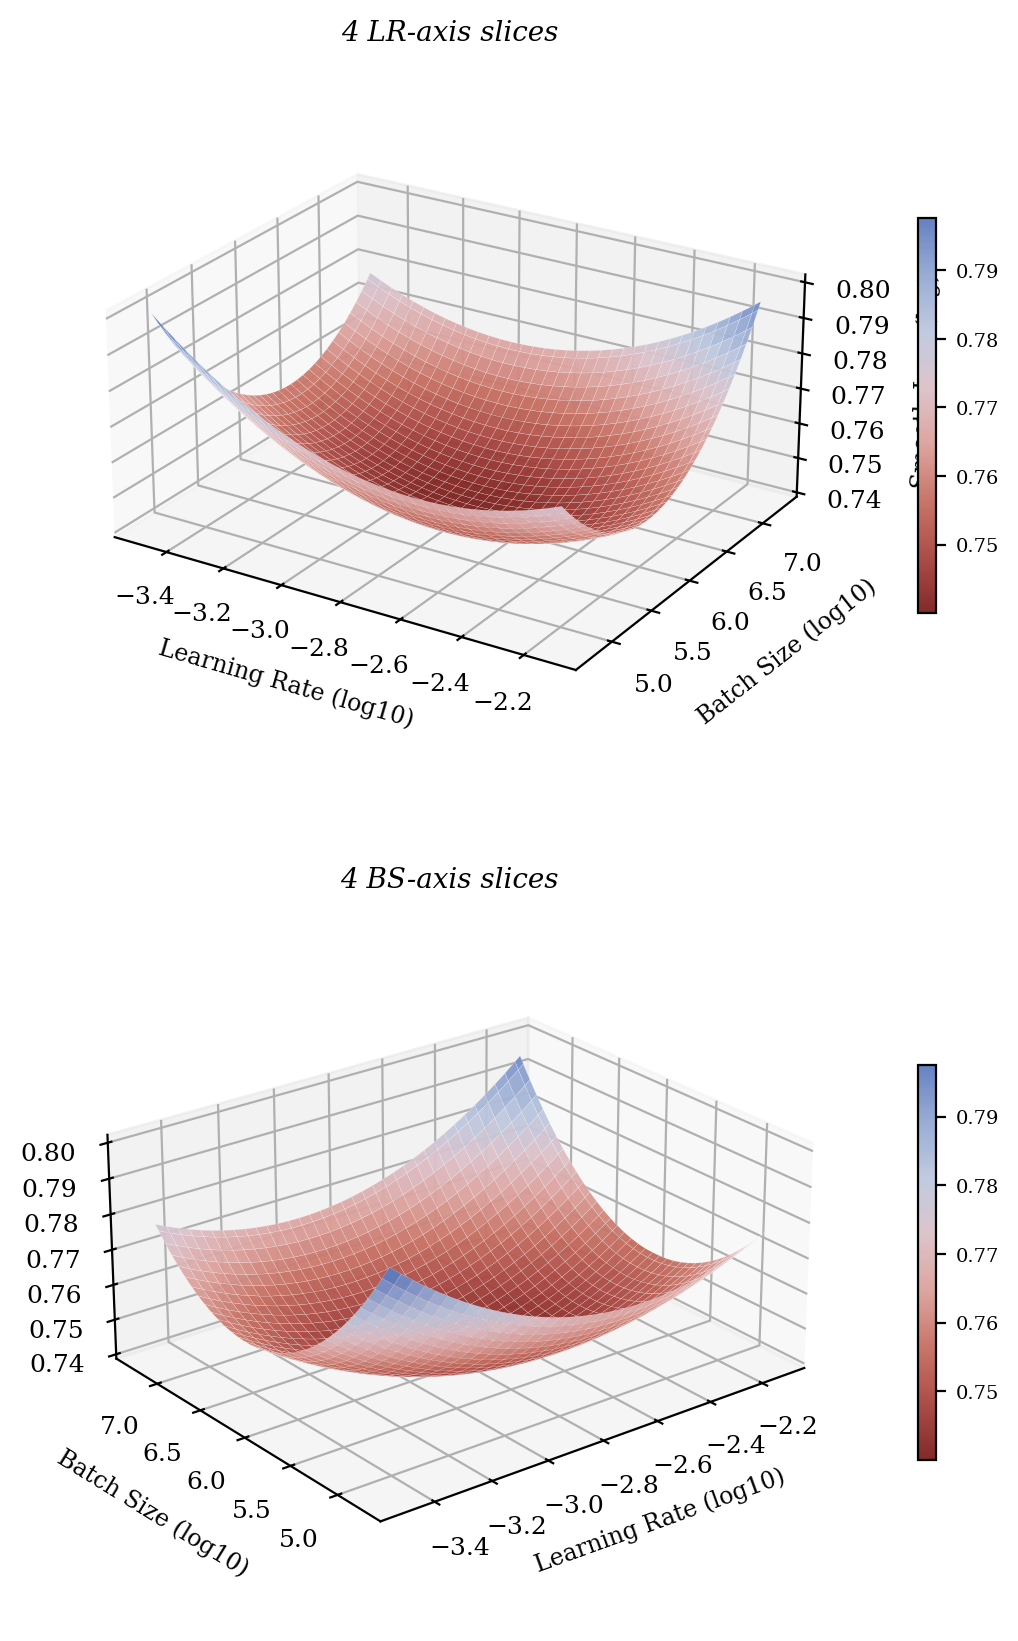 predictscale_3dloss.py3D Plot三维图
Step Law · 3D loss-landscape surface (LR vs. batch-size slices)
Step Law · 3D 损失曲面(LR × BS 双切片)
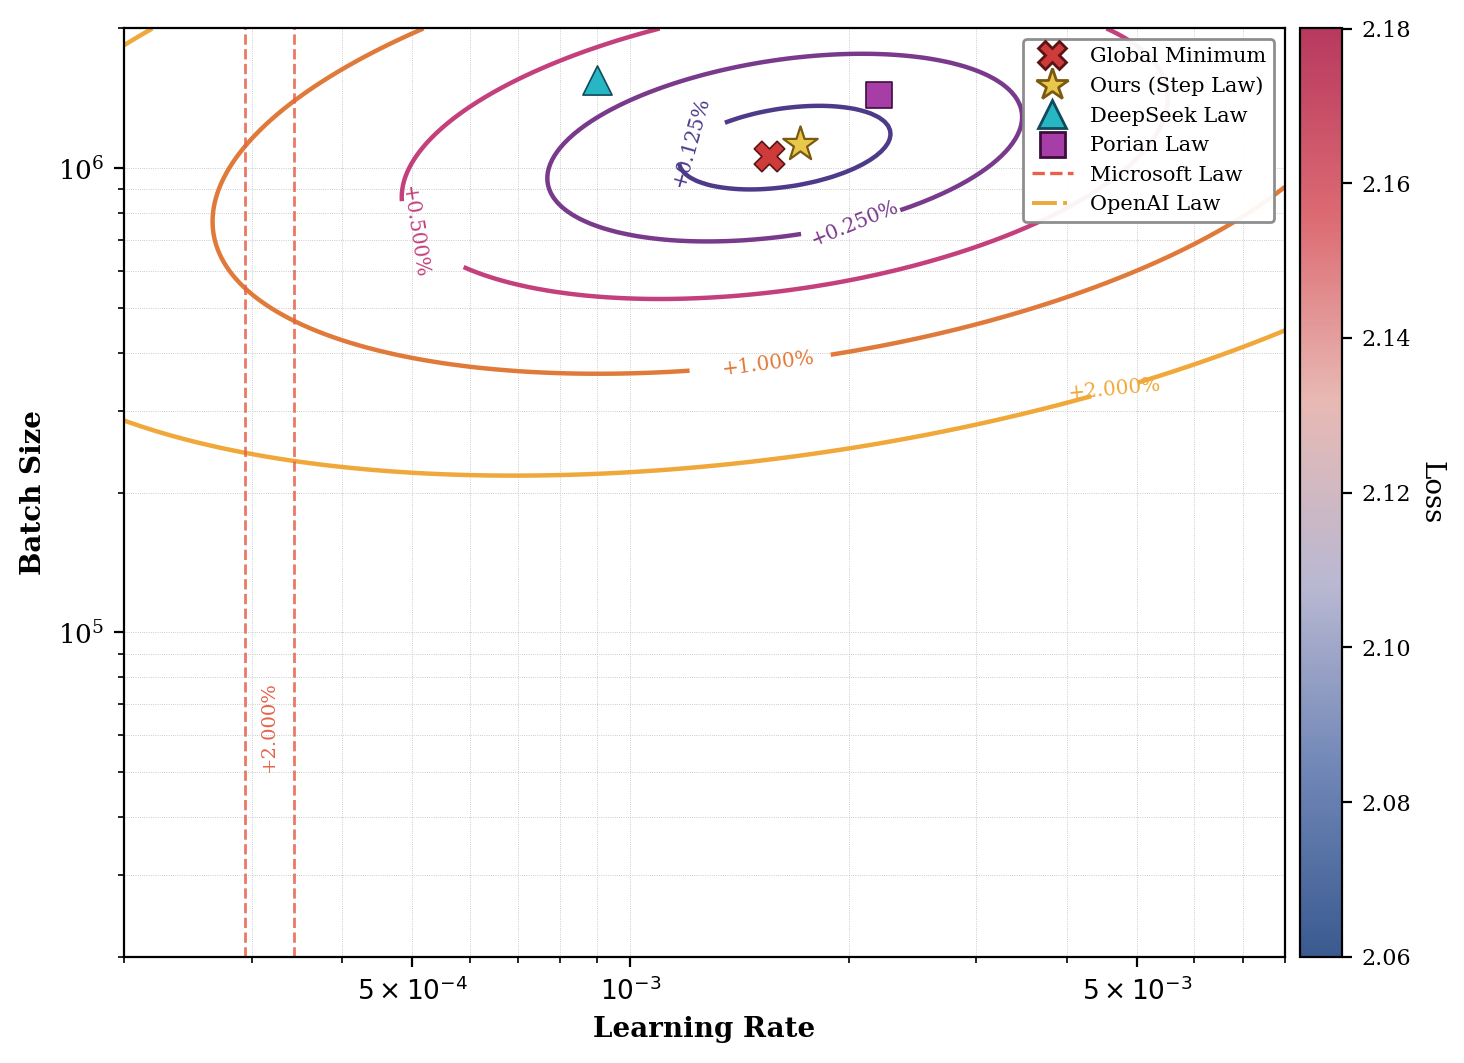 predictscale_contour.pyContour等高线图
Step Law · Hyperparameter contour plot of LR × batch size with optima
Step Law · 学习率×批大小超参数等高线图(带各算法最优点)
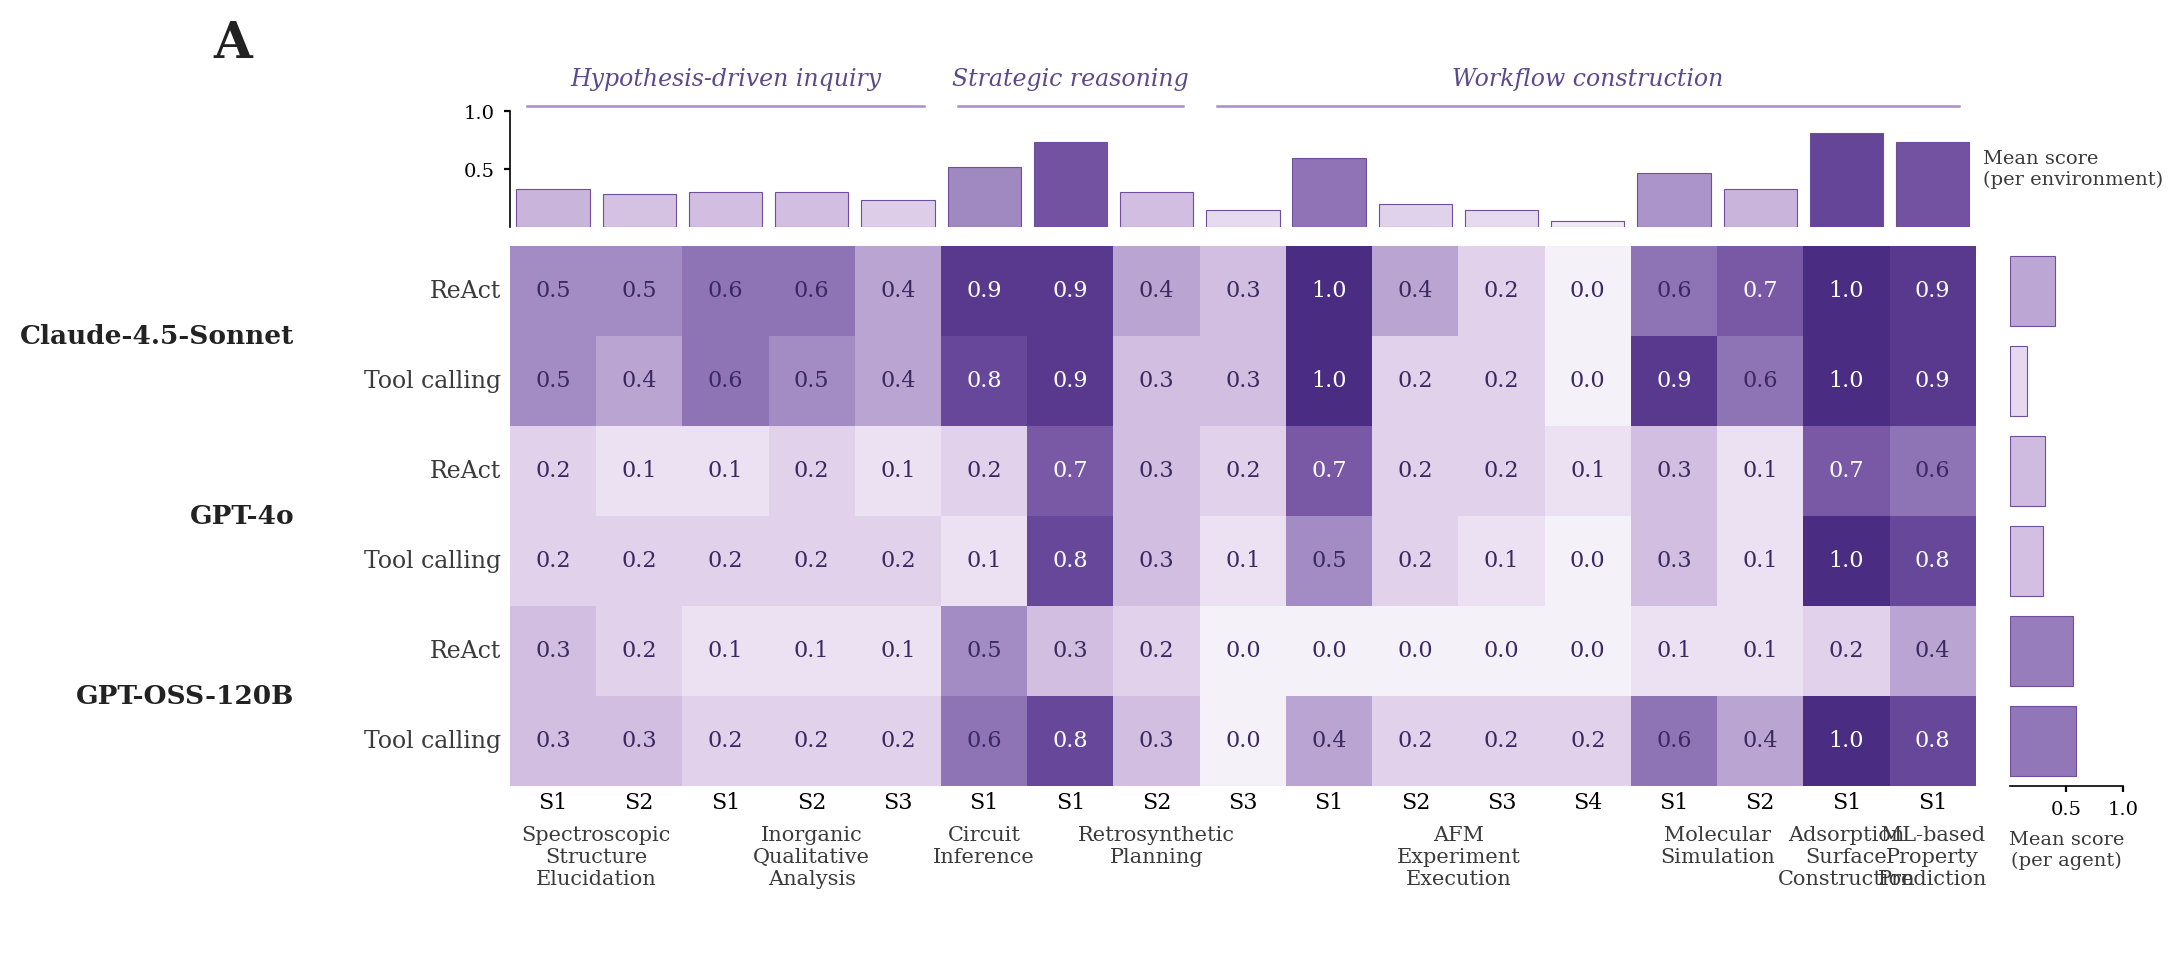 aiscientist_heatmap.pyHeatmap热力图 / 矩阵图
AI-Scientist · Model × environment-scope heatmap with marginal bars
AI-Scientist · 模型×环境-子任务热度图 + 边缘条形图
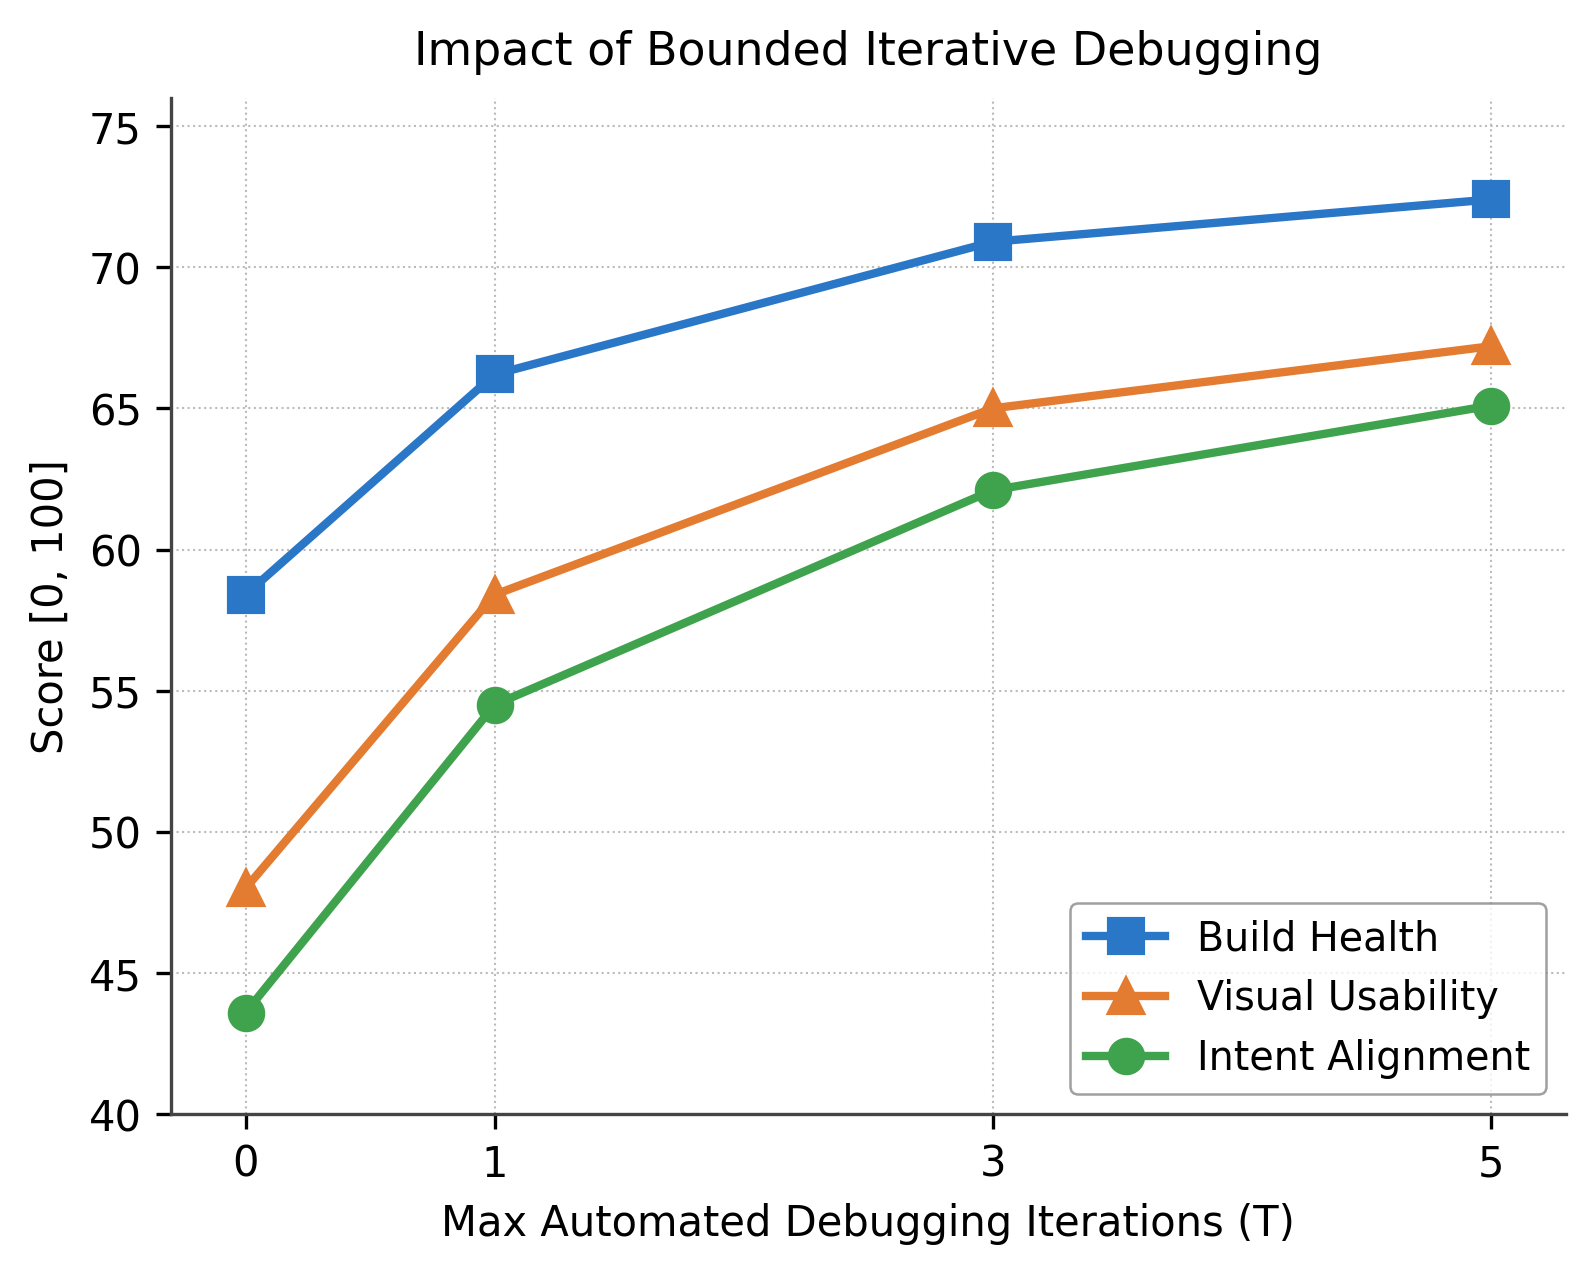 opengame_debug_iters.pyLine Chart折线图
OpenGame · 3-line plot of build / visual / intent vs debug iterations
OpenGame · 三指标(构建 / 视觉 / 意图)随调试迭代的折线图
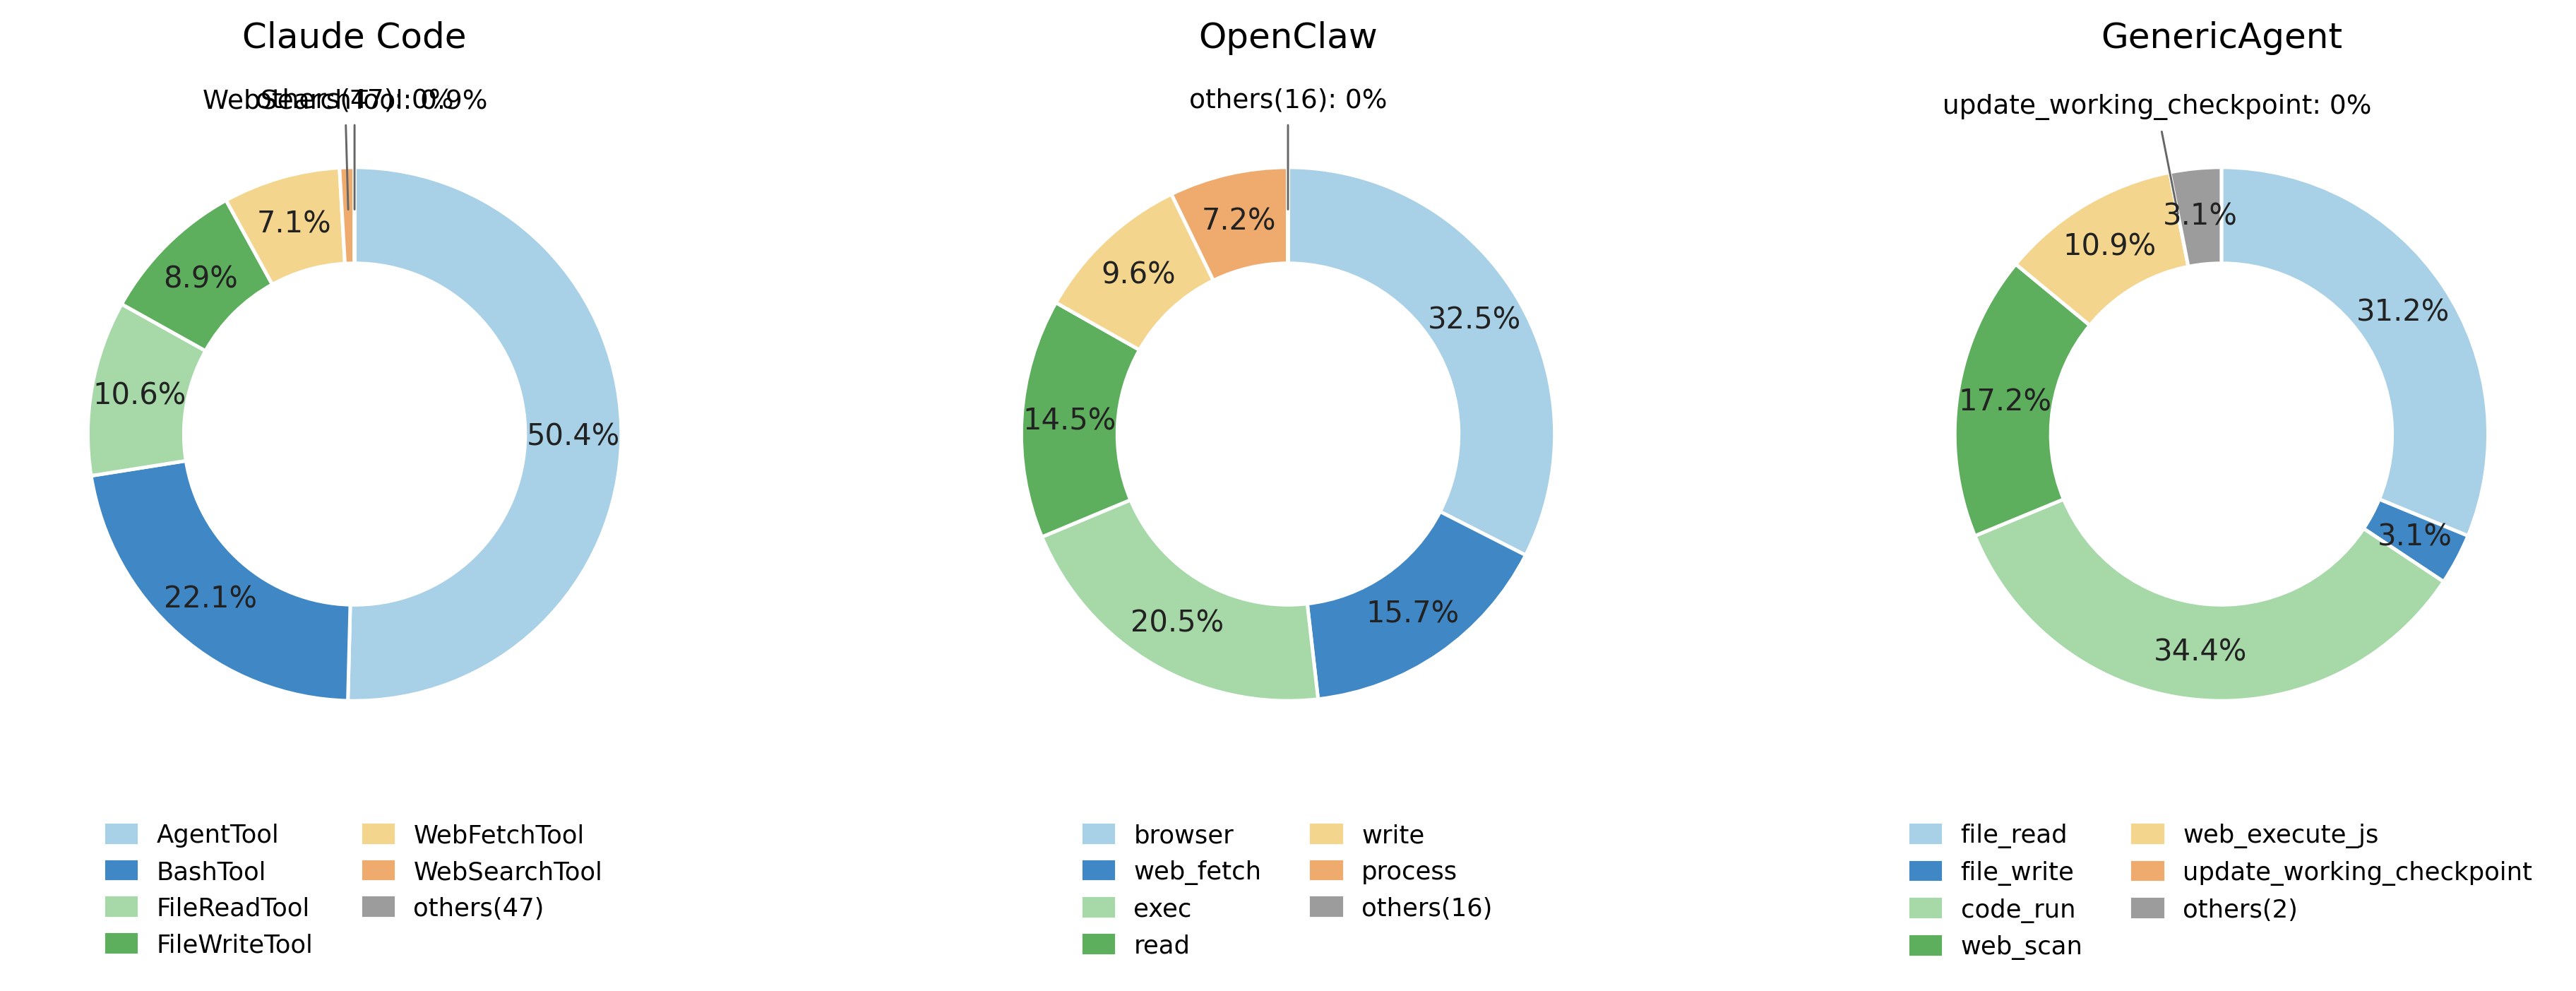 genericagent_tool_donut.pyPie / Donut饼图 / 环形图
GenericAgent · Three donut charts of tool-call distribution per agent
GenericAgent · 三 agent 工具调用分布甜甜圈饼图
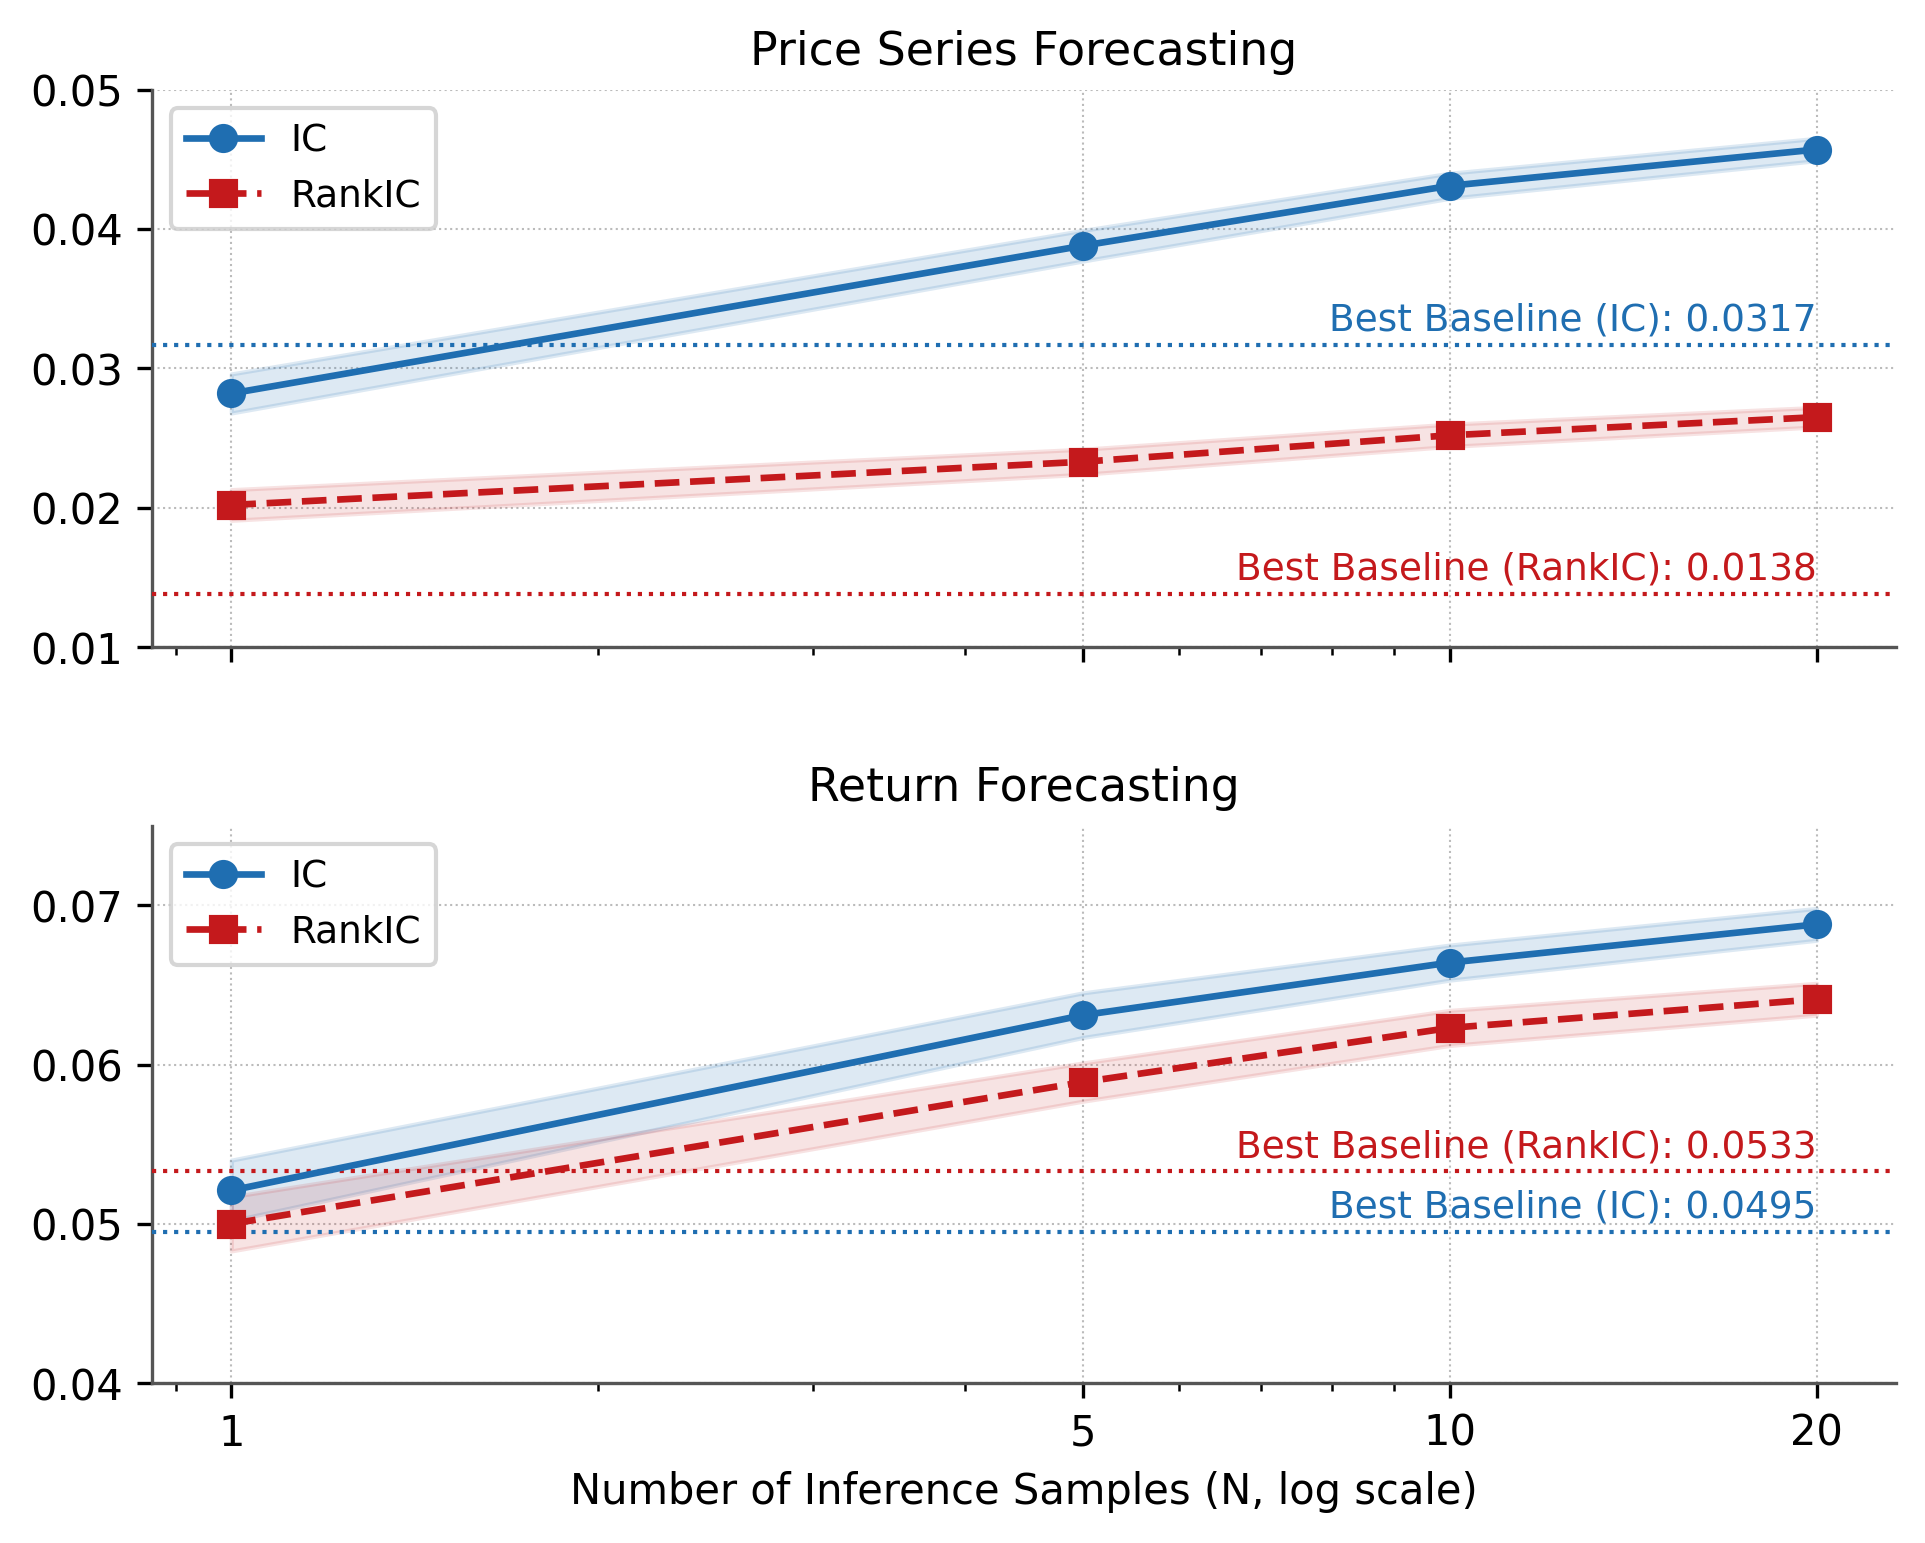 kronos_test_time_scaling.pyLine Chart折线图
Kronos · Two-panel test-time scaling with std band and dotted baselines
Kronos · 双面板测试时缩放:置信带 + 虚线基线参考
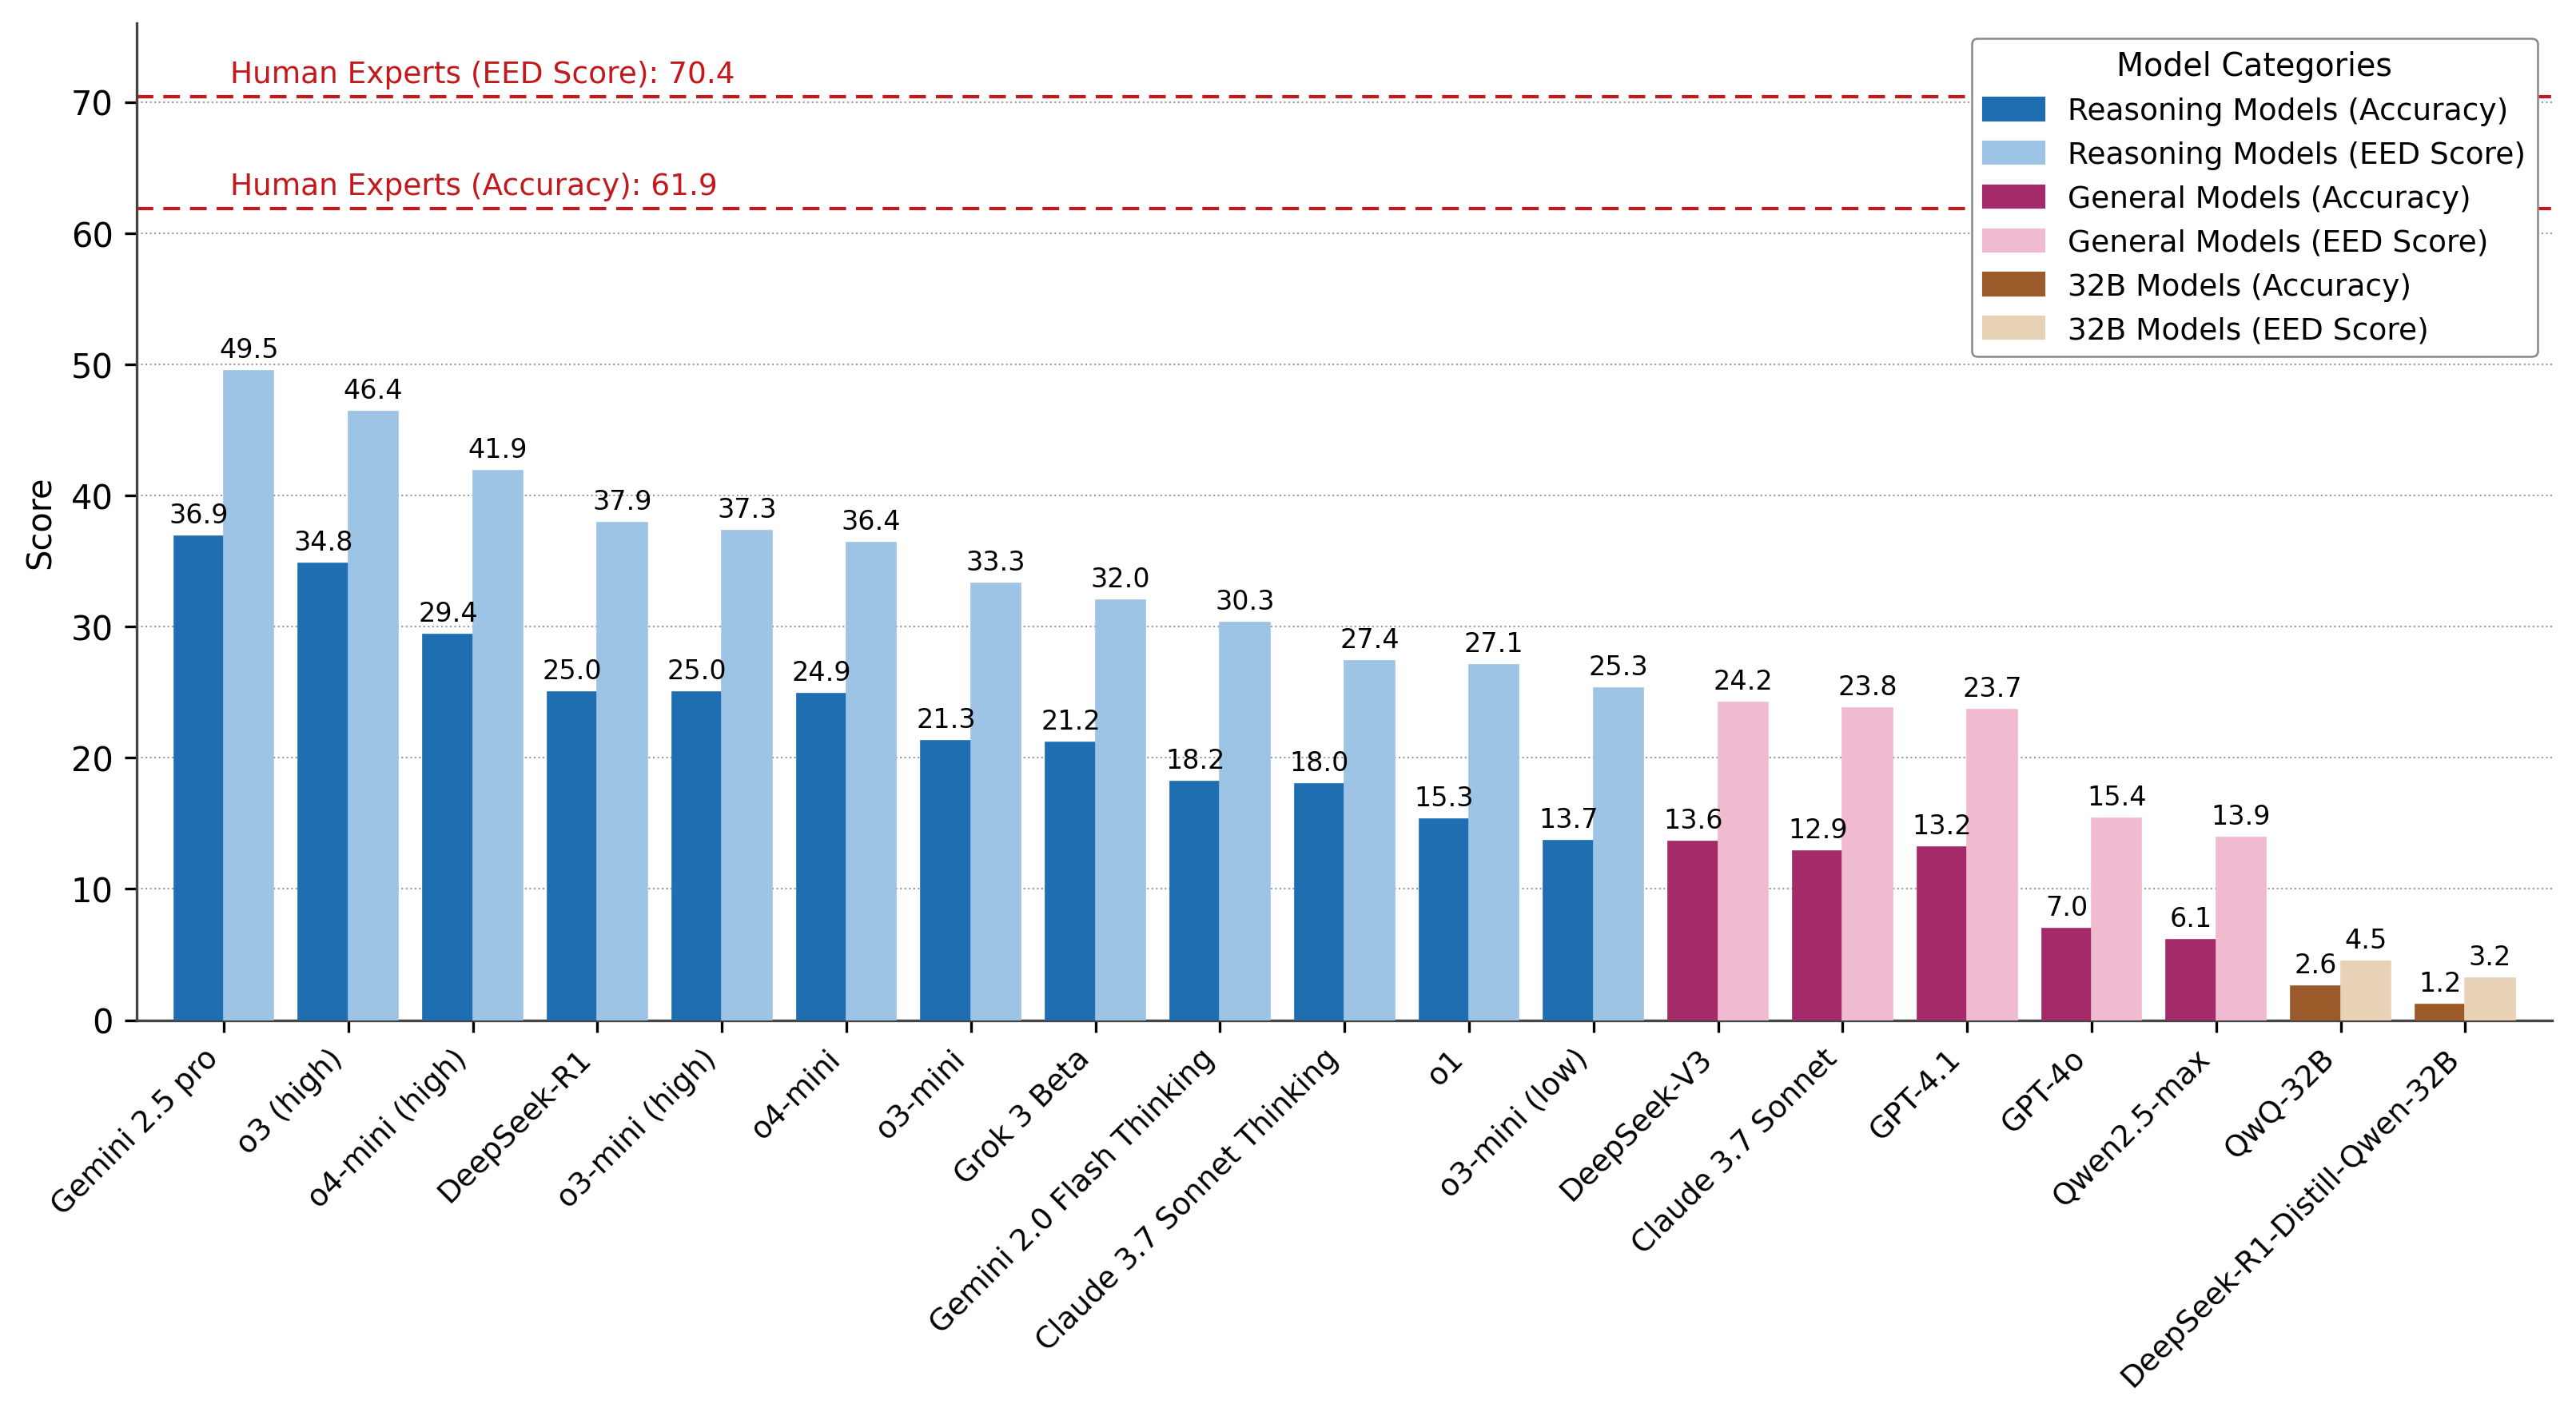 phybench_model_perf.pyBar Chart柱状图
PHYBench · 19-model paired bars with category colours and human reference lines
PHYBench · 19 模型配对柱(Acc + EED)+ 类别配色 + 人类参考线
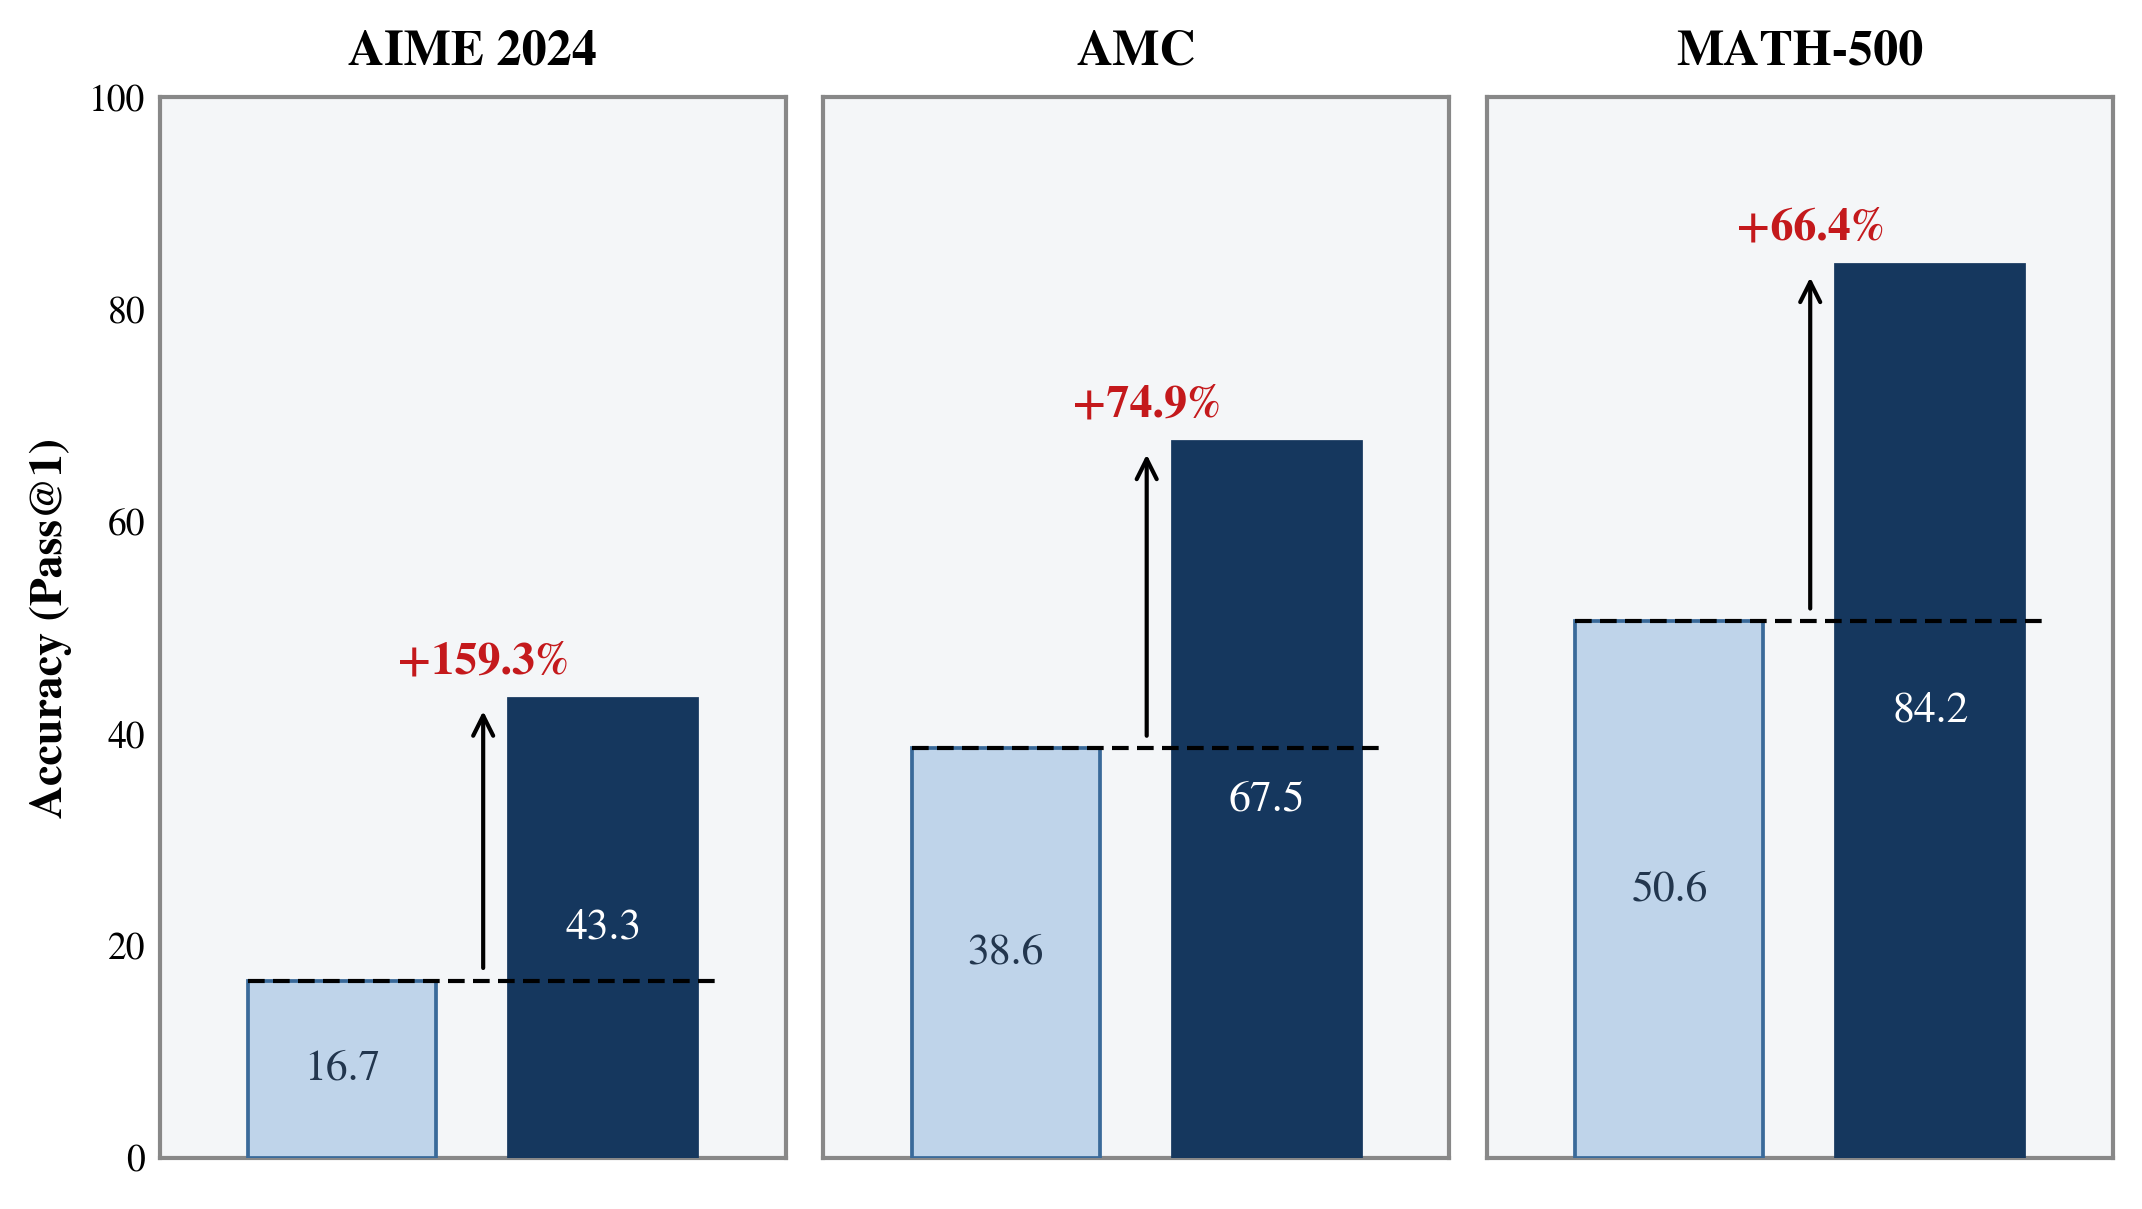 ttrl_main_results.pyBar Chart柱状图
TTRL · 3-panel paired bars with delta arrows on three benchmarks
TTRL · 三联配对柱图:基线 vs TTRL,三项基准的增益箭头
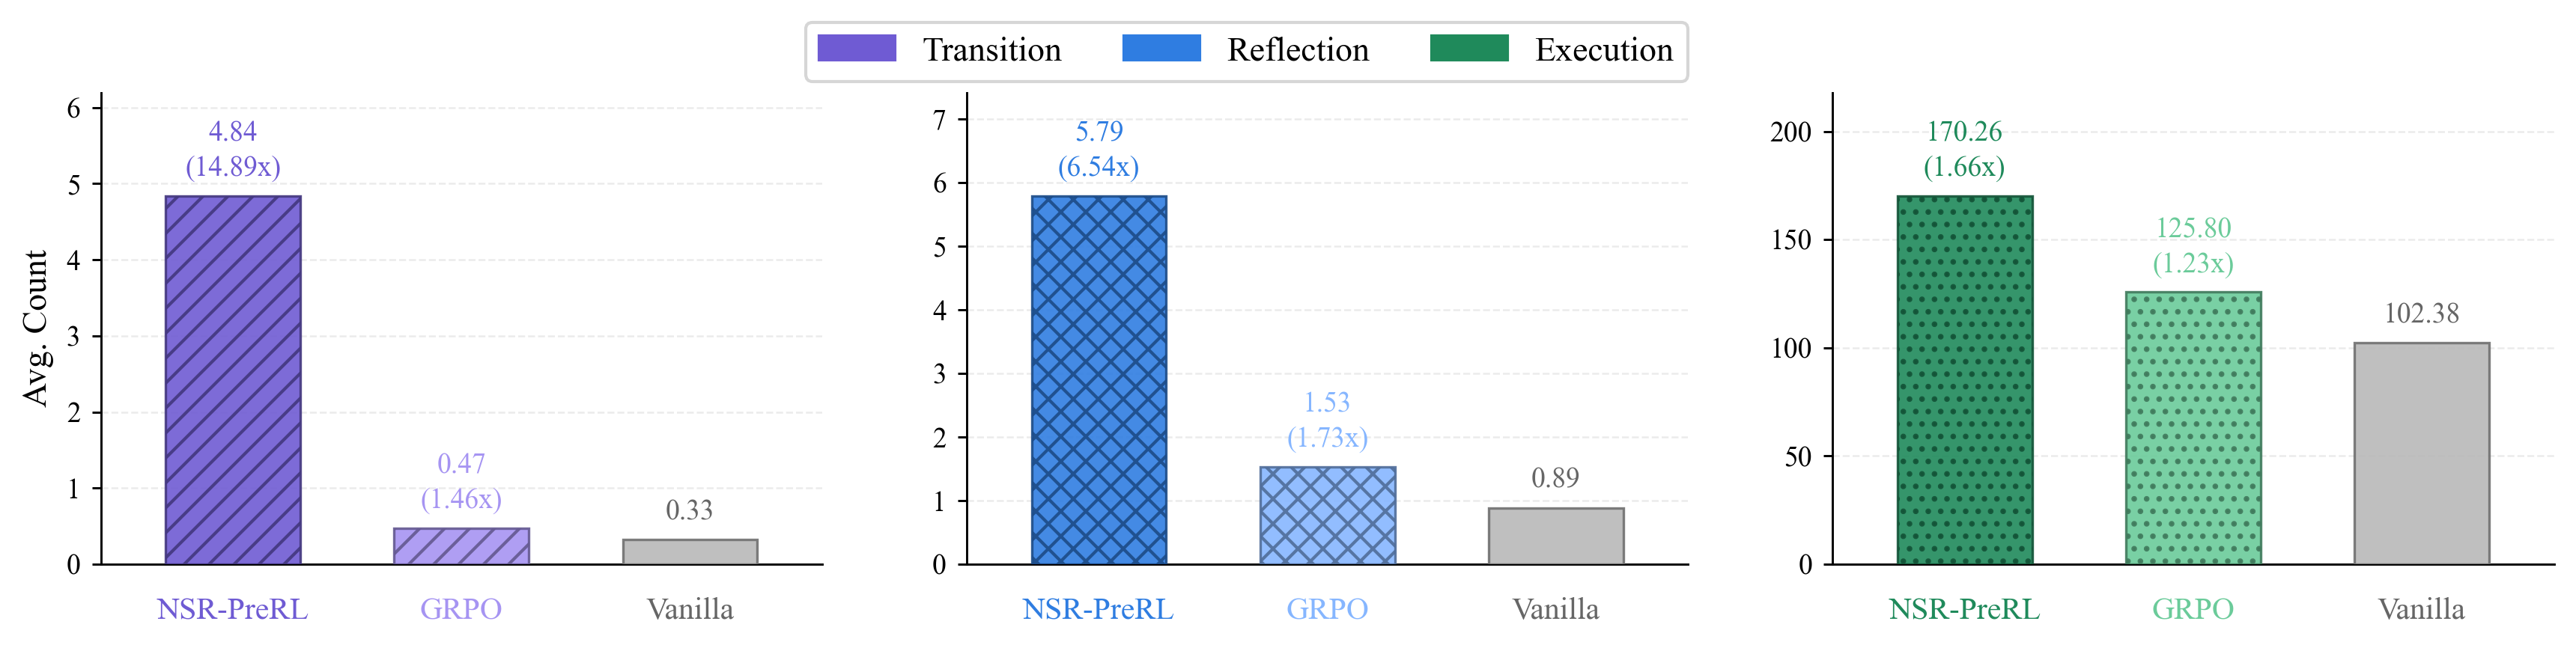 prerl_behavior_bars.pyBar Chart柱状图
PreRL · 1×3 hatched bar panels with multiplier annotations
PreRL · 1×3 斜线/网格 hatch 柱图 + 倍率标注
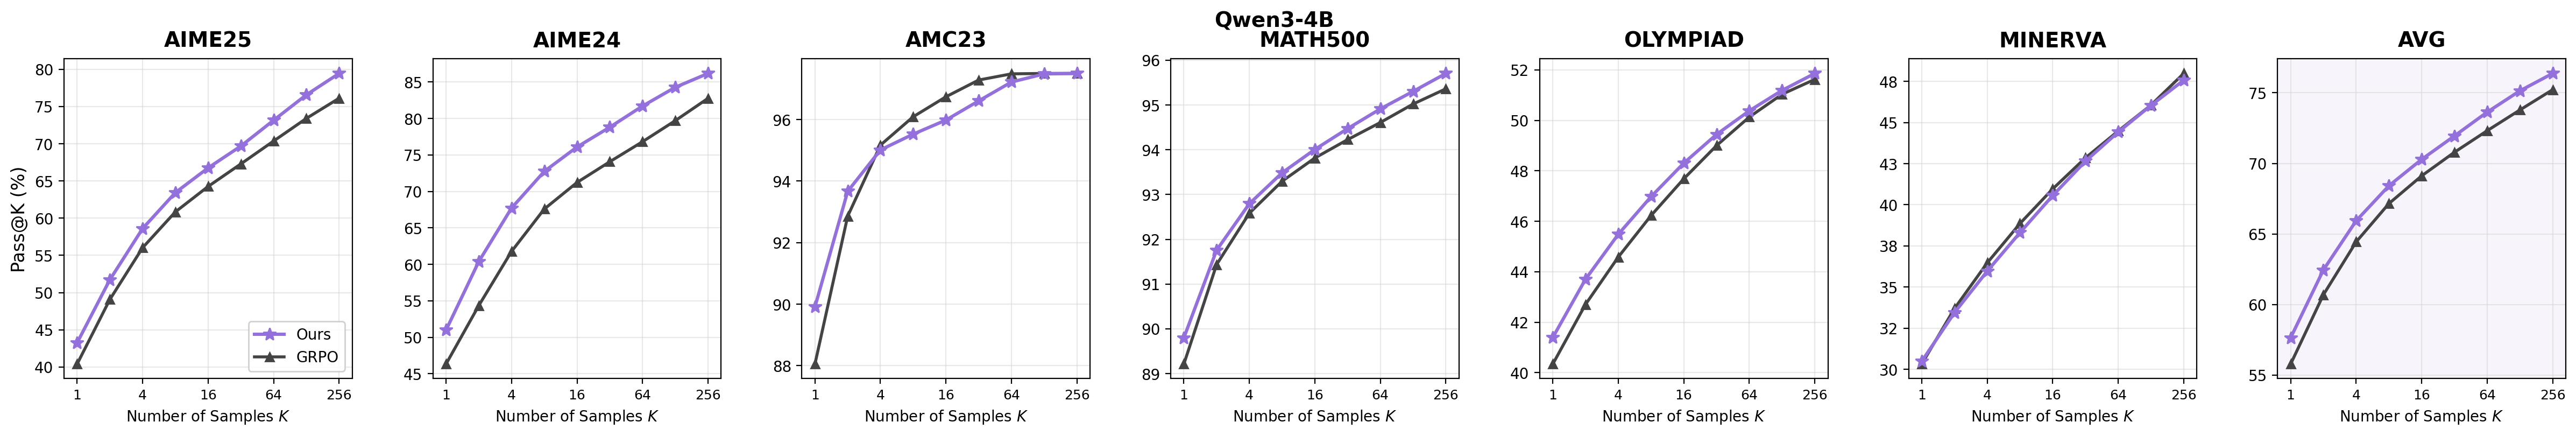 prerl_passk_qwen4b.pyLine Chart折线图
PreRL · 1×7 small-multiples Pass@K curves on Qwen3-4B
PreRL · Qwen3-4B 1×7 Pass@K 小多面板
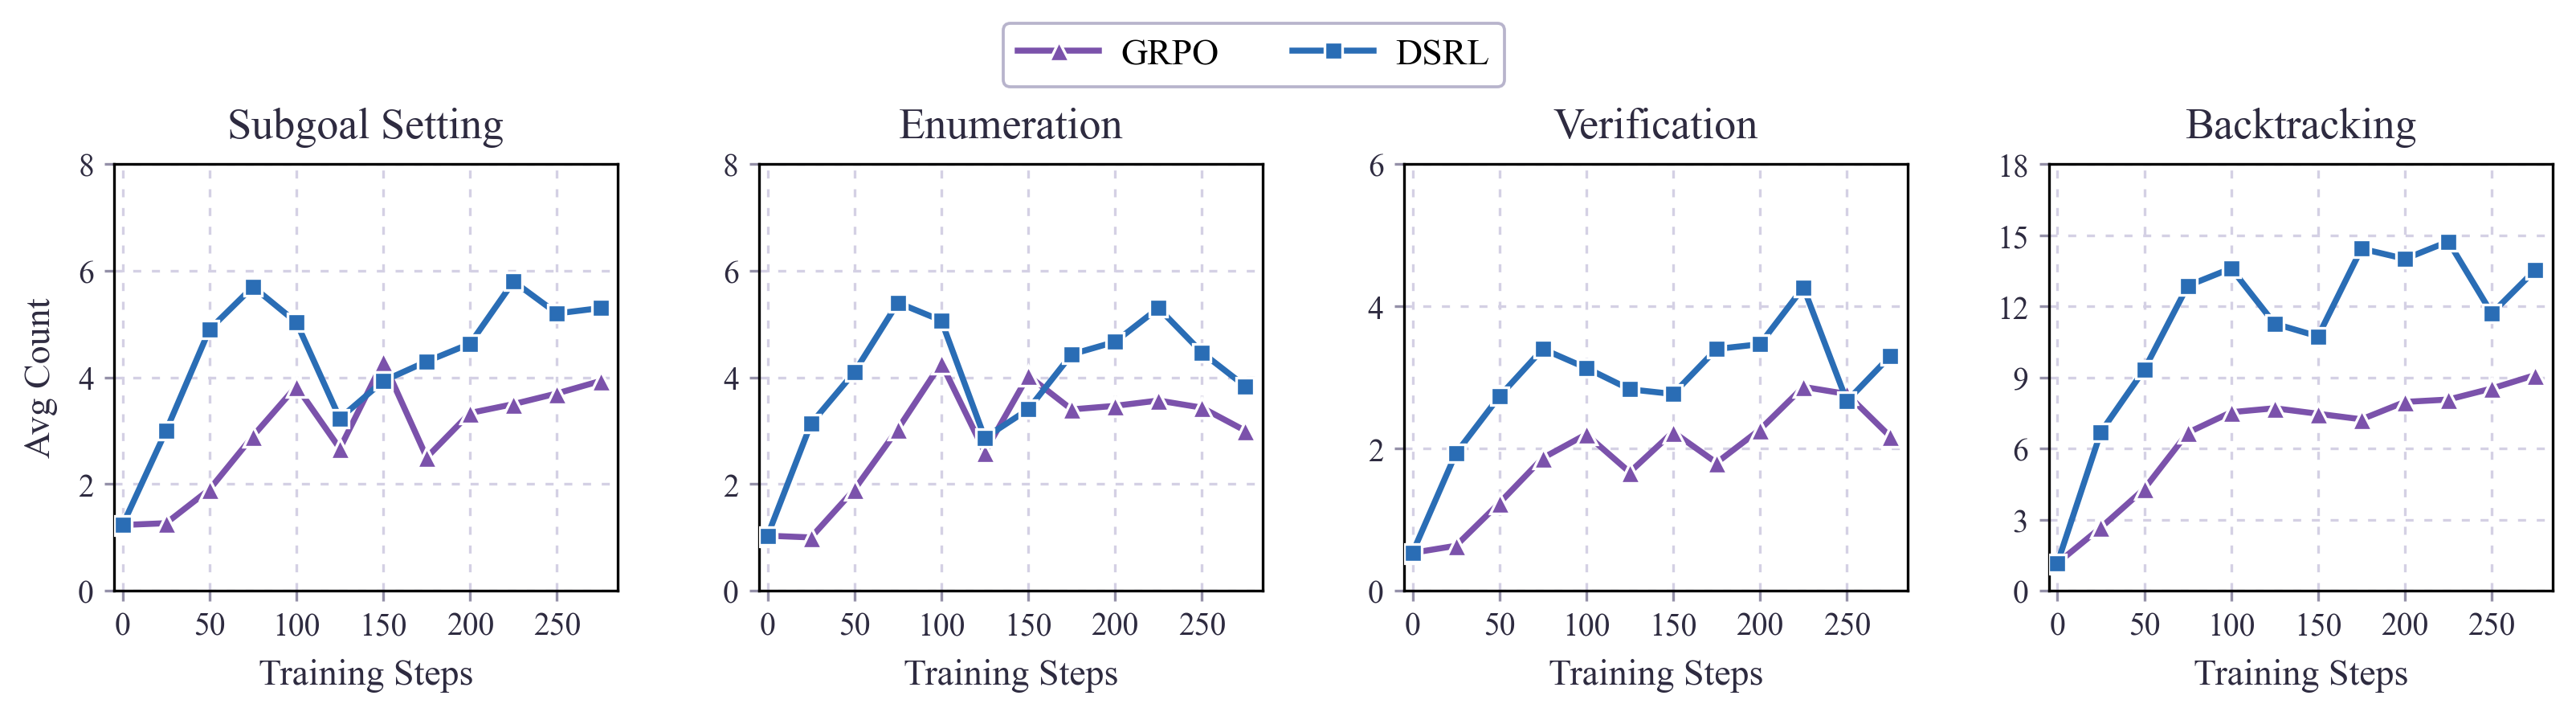 prerl_behavior_panels.pyLine Chart折线图
PreRL · 1×4 line panels of cognitive-behavior counts vs step
PreRL · 1×4 折线面板:认知行为计数 vs 训练步数
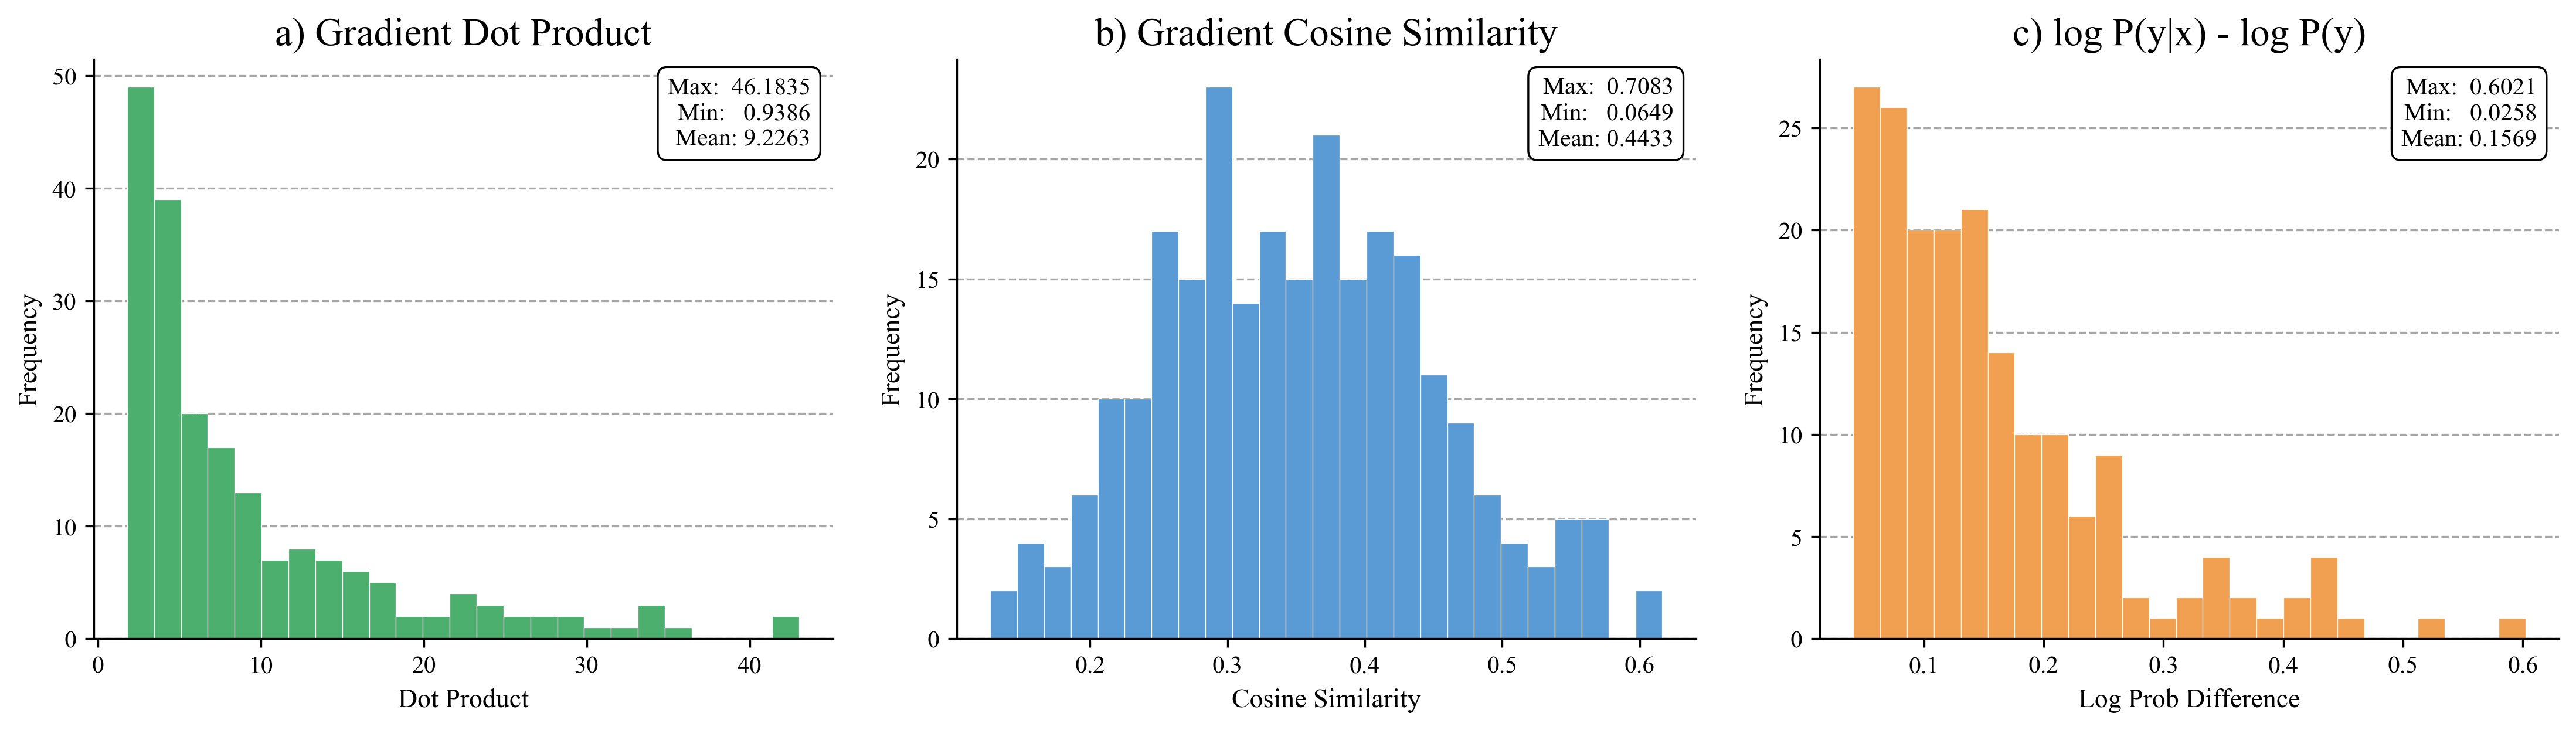 prerl_grad_metrics_hist.pyHistogram直方图 / 频次分布
PreRL · Three-panel gradient-metric histograms with stats box
PreRL · 三联梯度量直方图 + 统计信息框
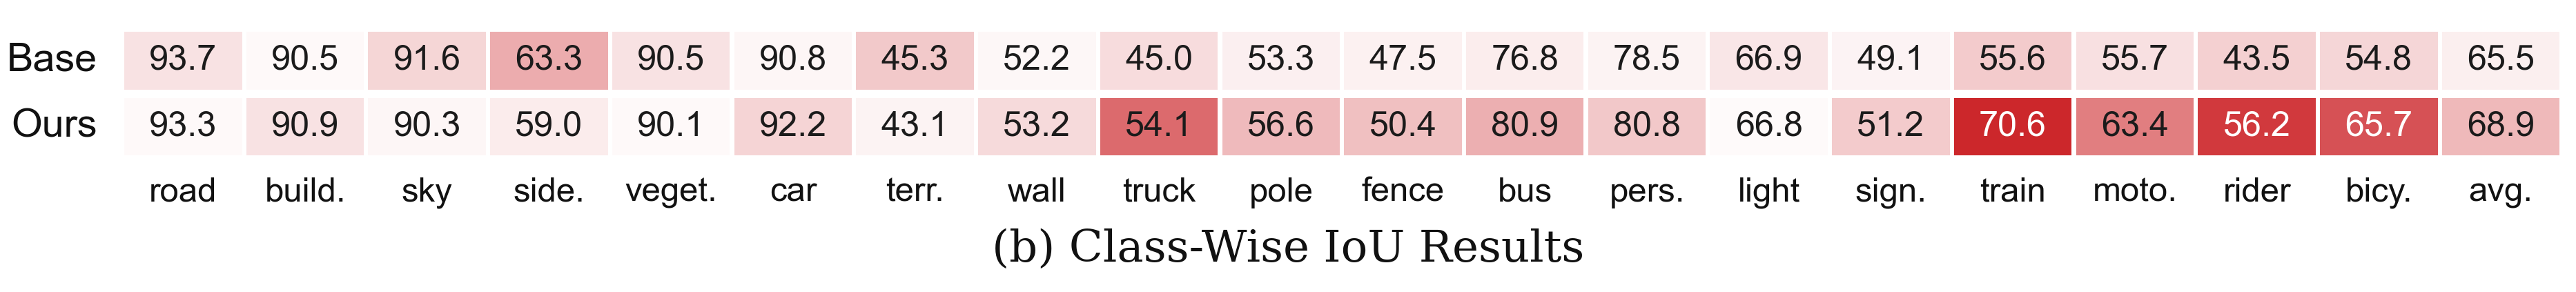 classwise_iou.pyTable表格
Class-wise IoU · 2-row heat-shaded comparison table
Class-wise IoU · 双行热度色块对比表
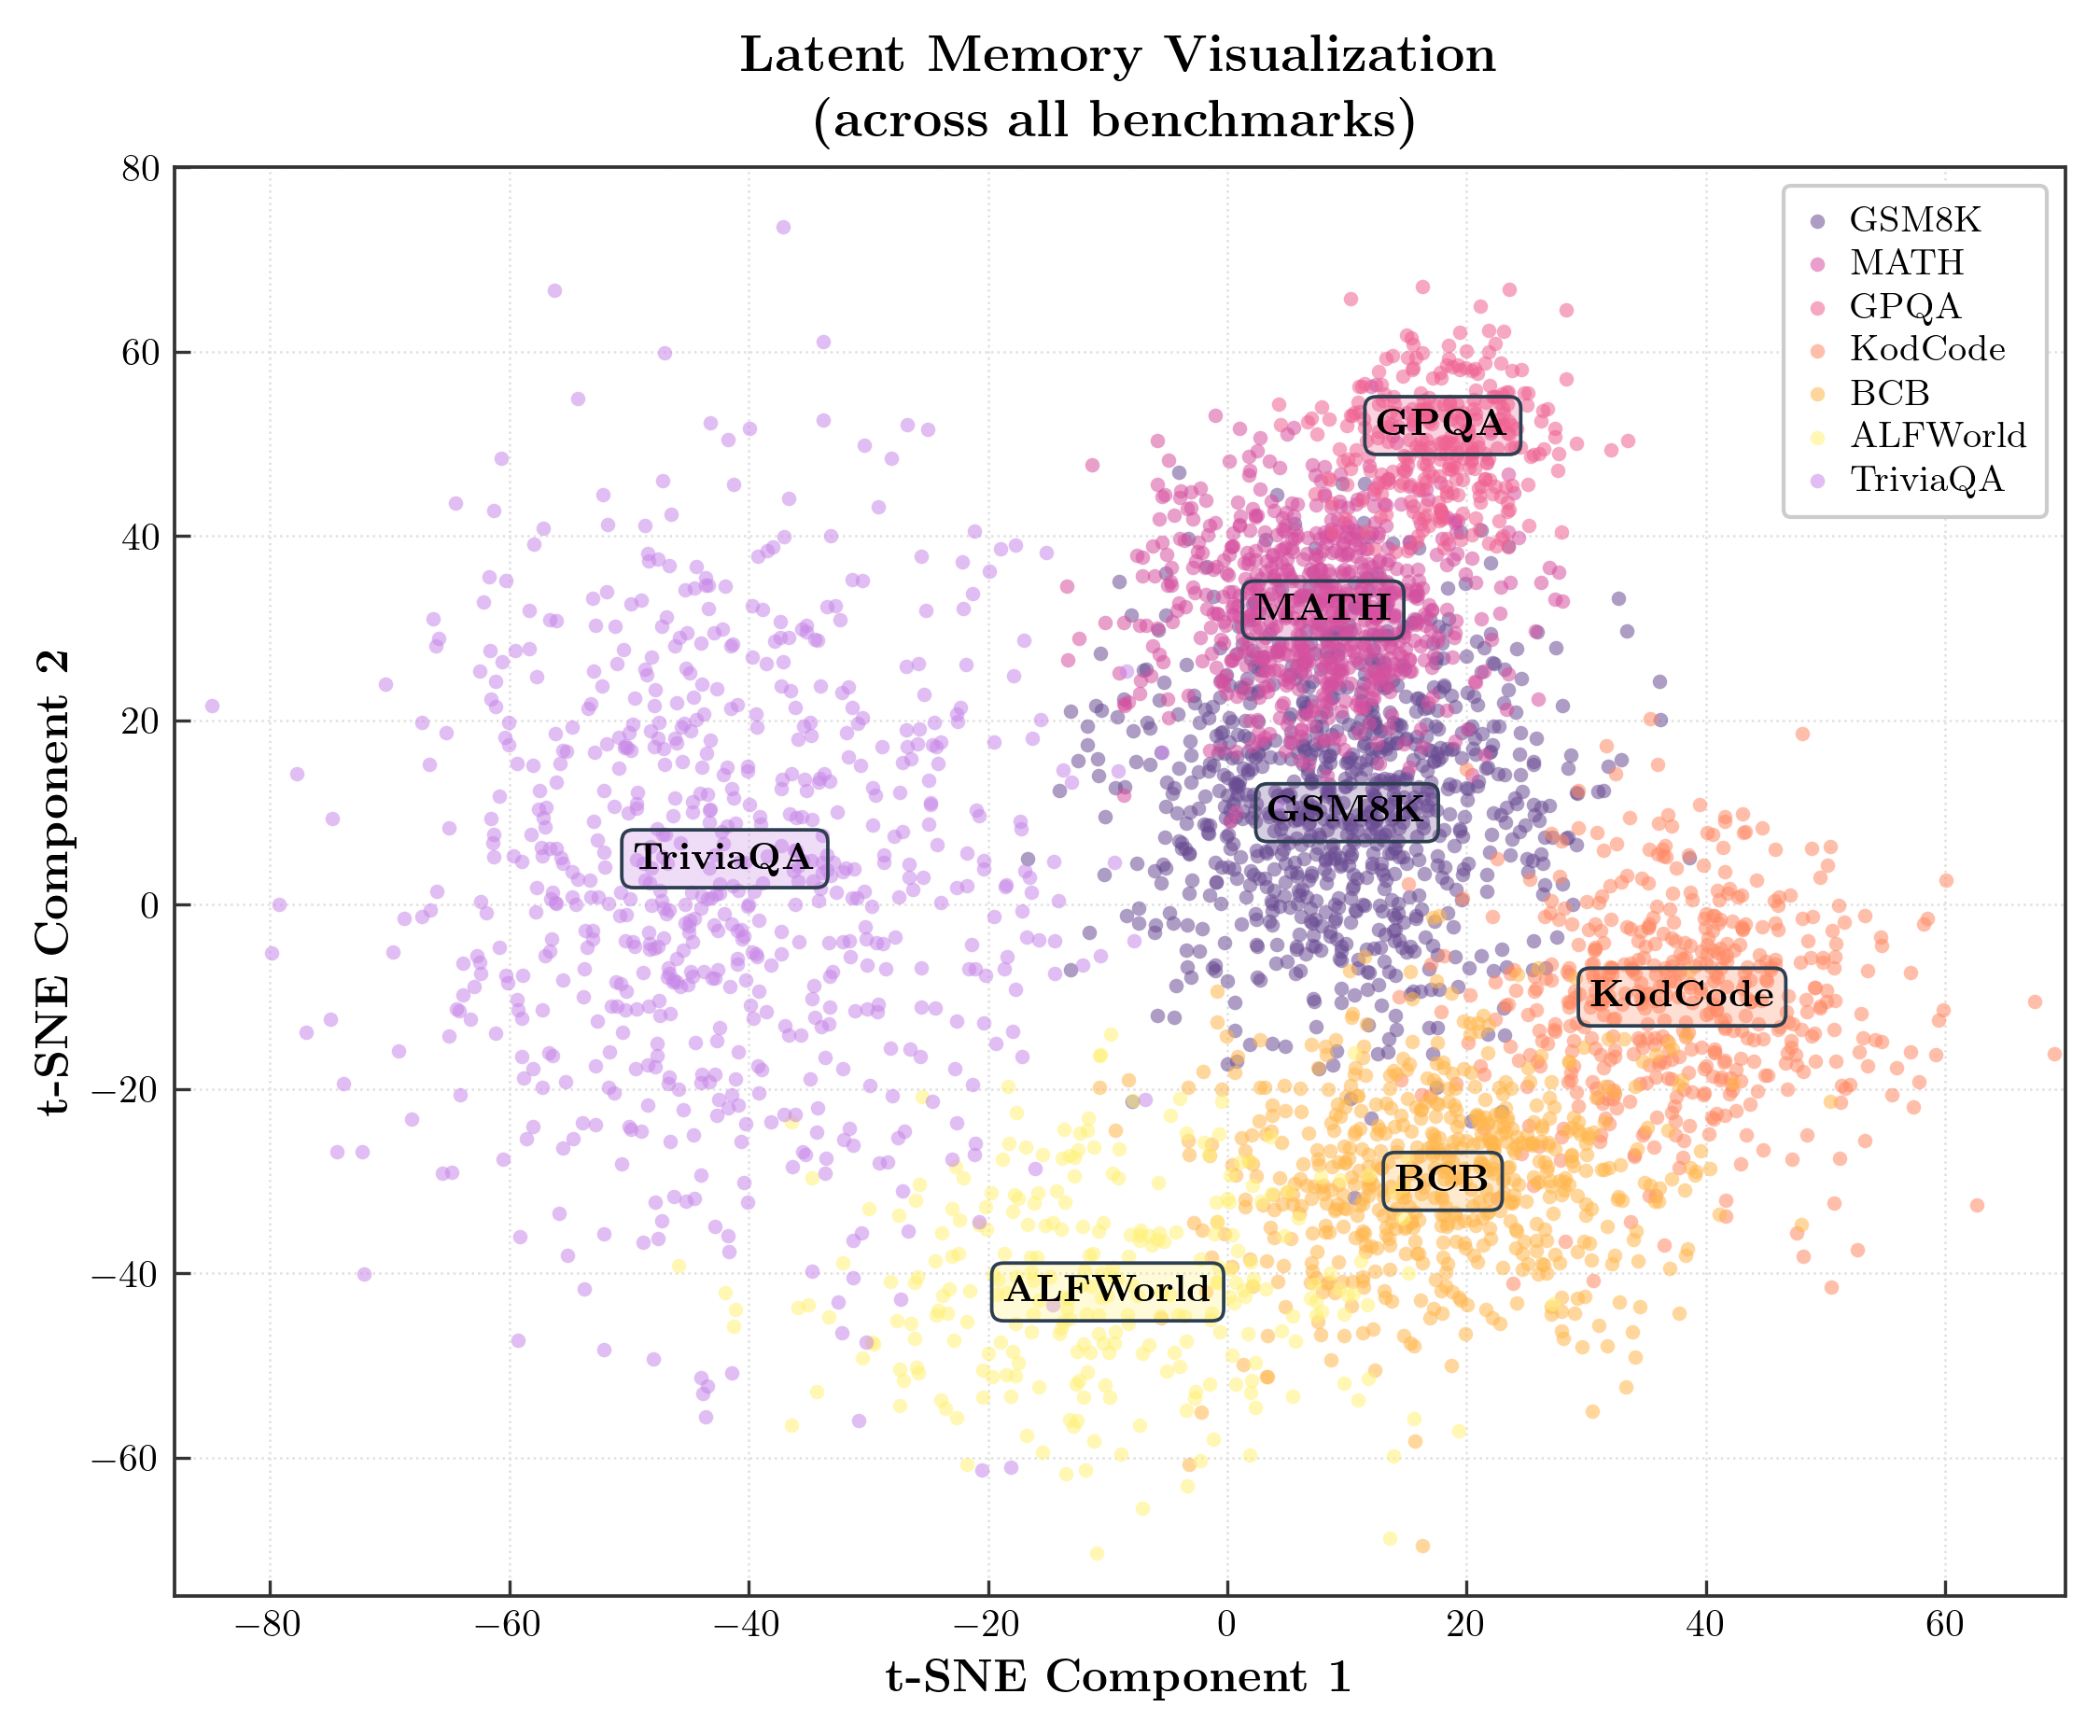 scatter_tsne.pyScatter Plot散点图
MemGen · t-SNE latent-memory clusters with rounded annotation pills
MemGen · t-SNE 隐空间记忆聚类 + 圆角注释胶囊
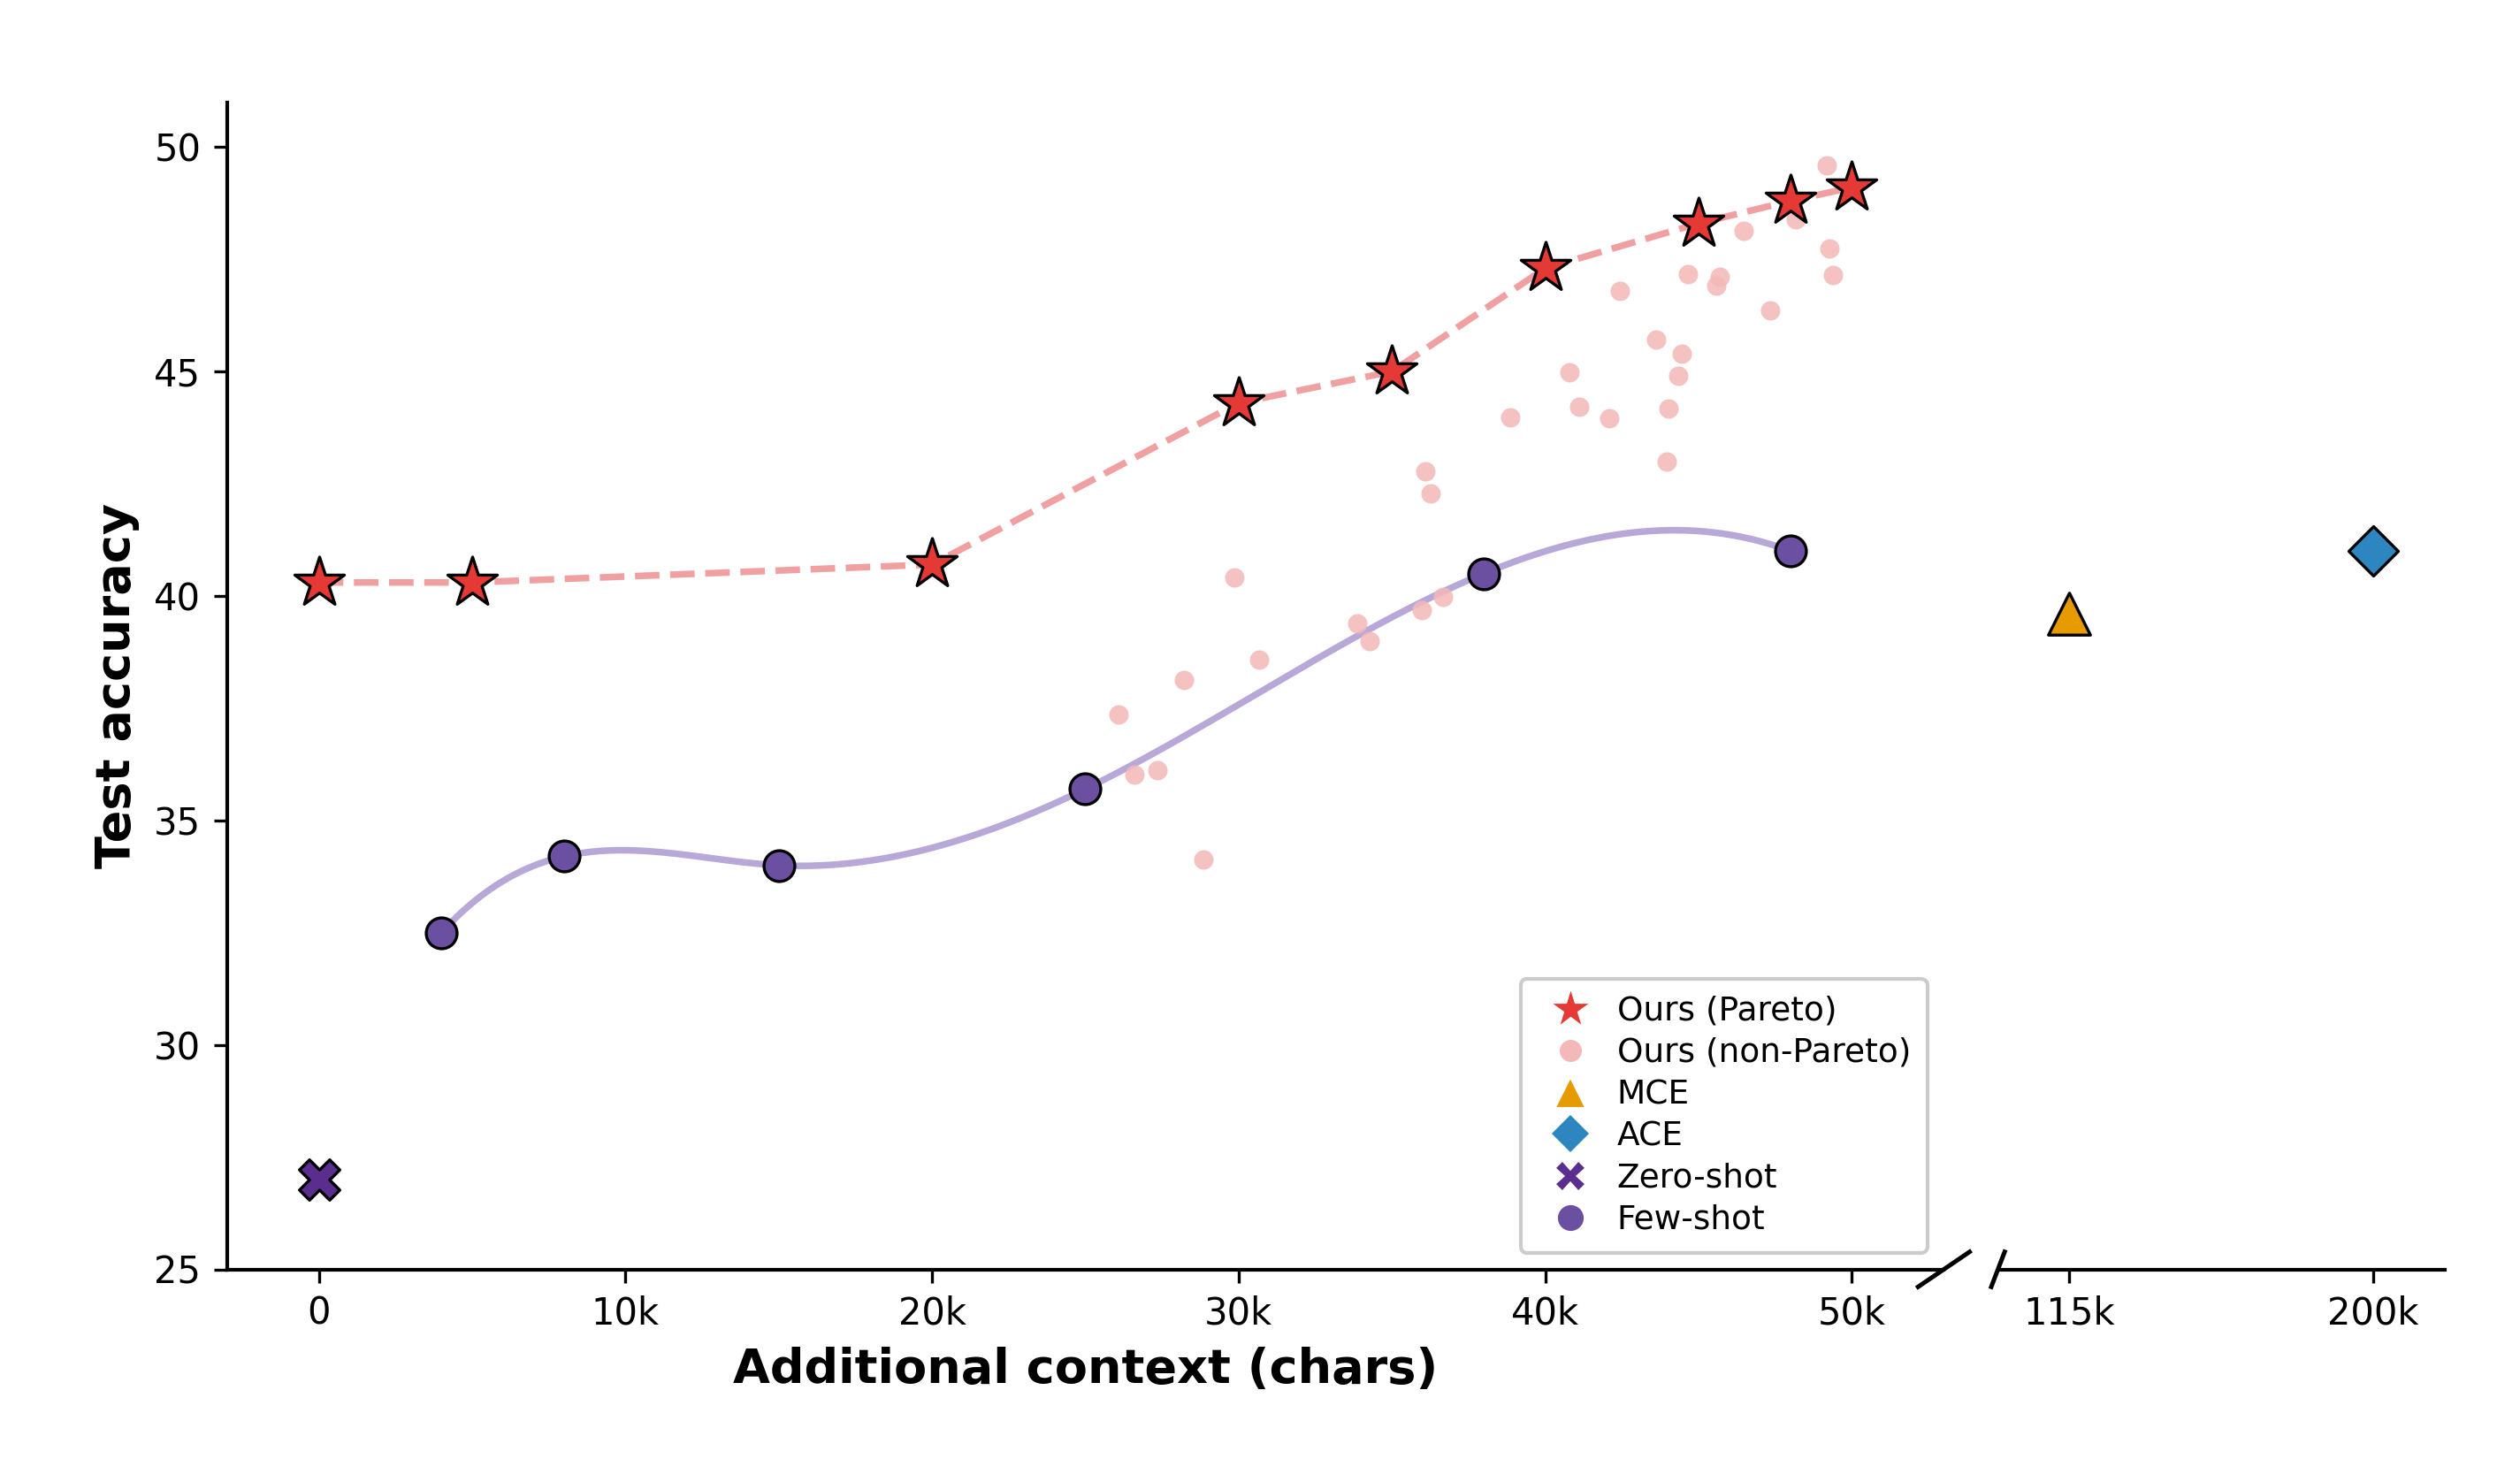 scatter_break.pyScatter Plot散点图
Meta-Harness · Broken-x-axis Pareto scatter with multi-marker legend
Meta-Harness · 折断 X 轴 Pareto 散点 + 多标记图例
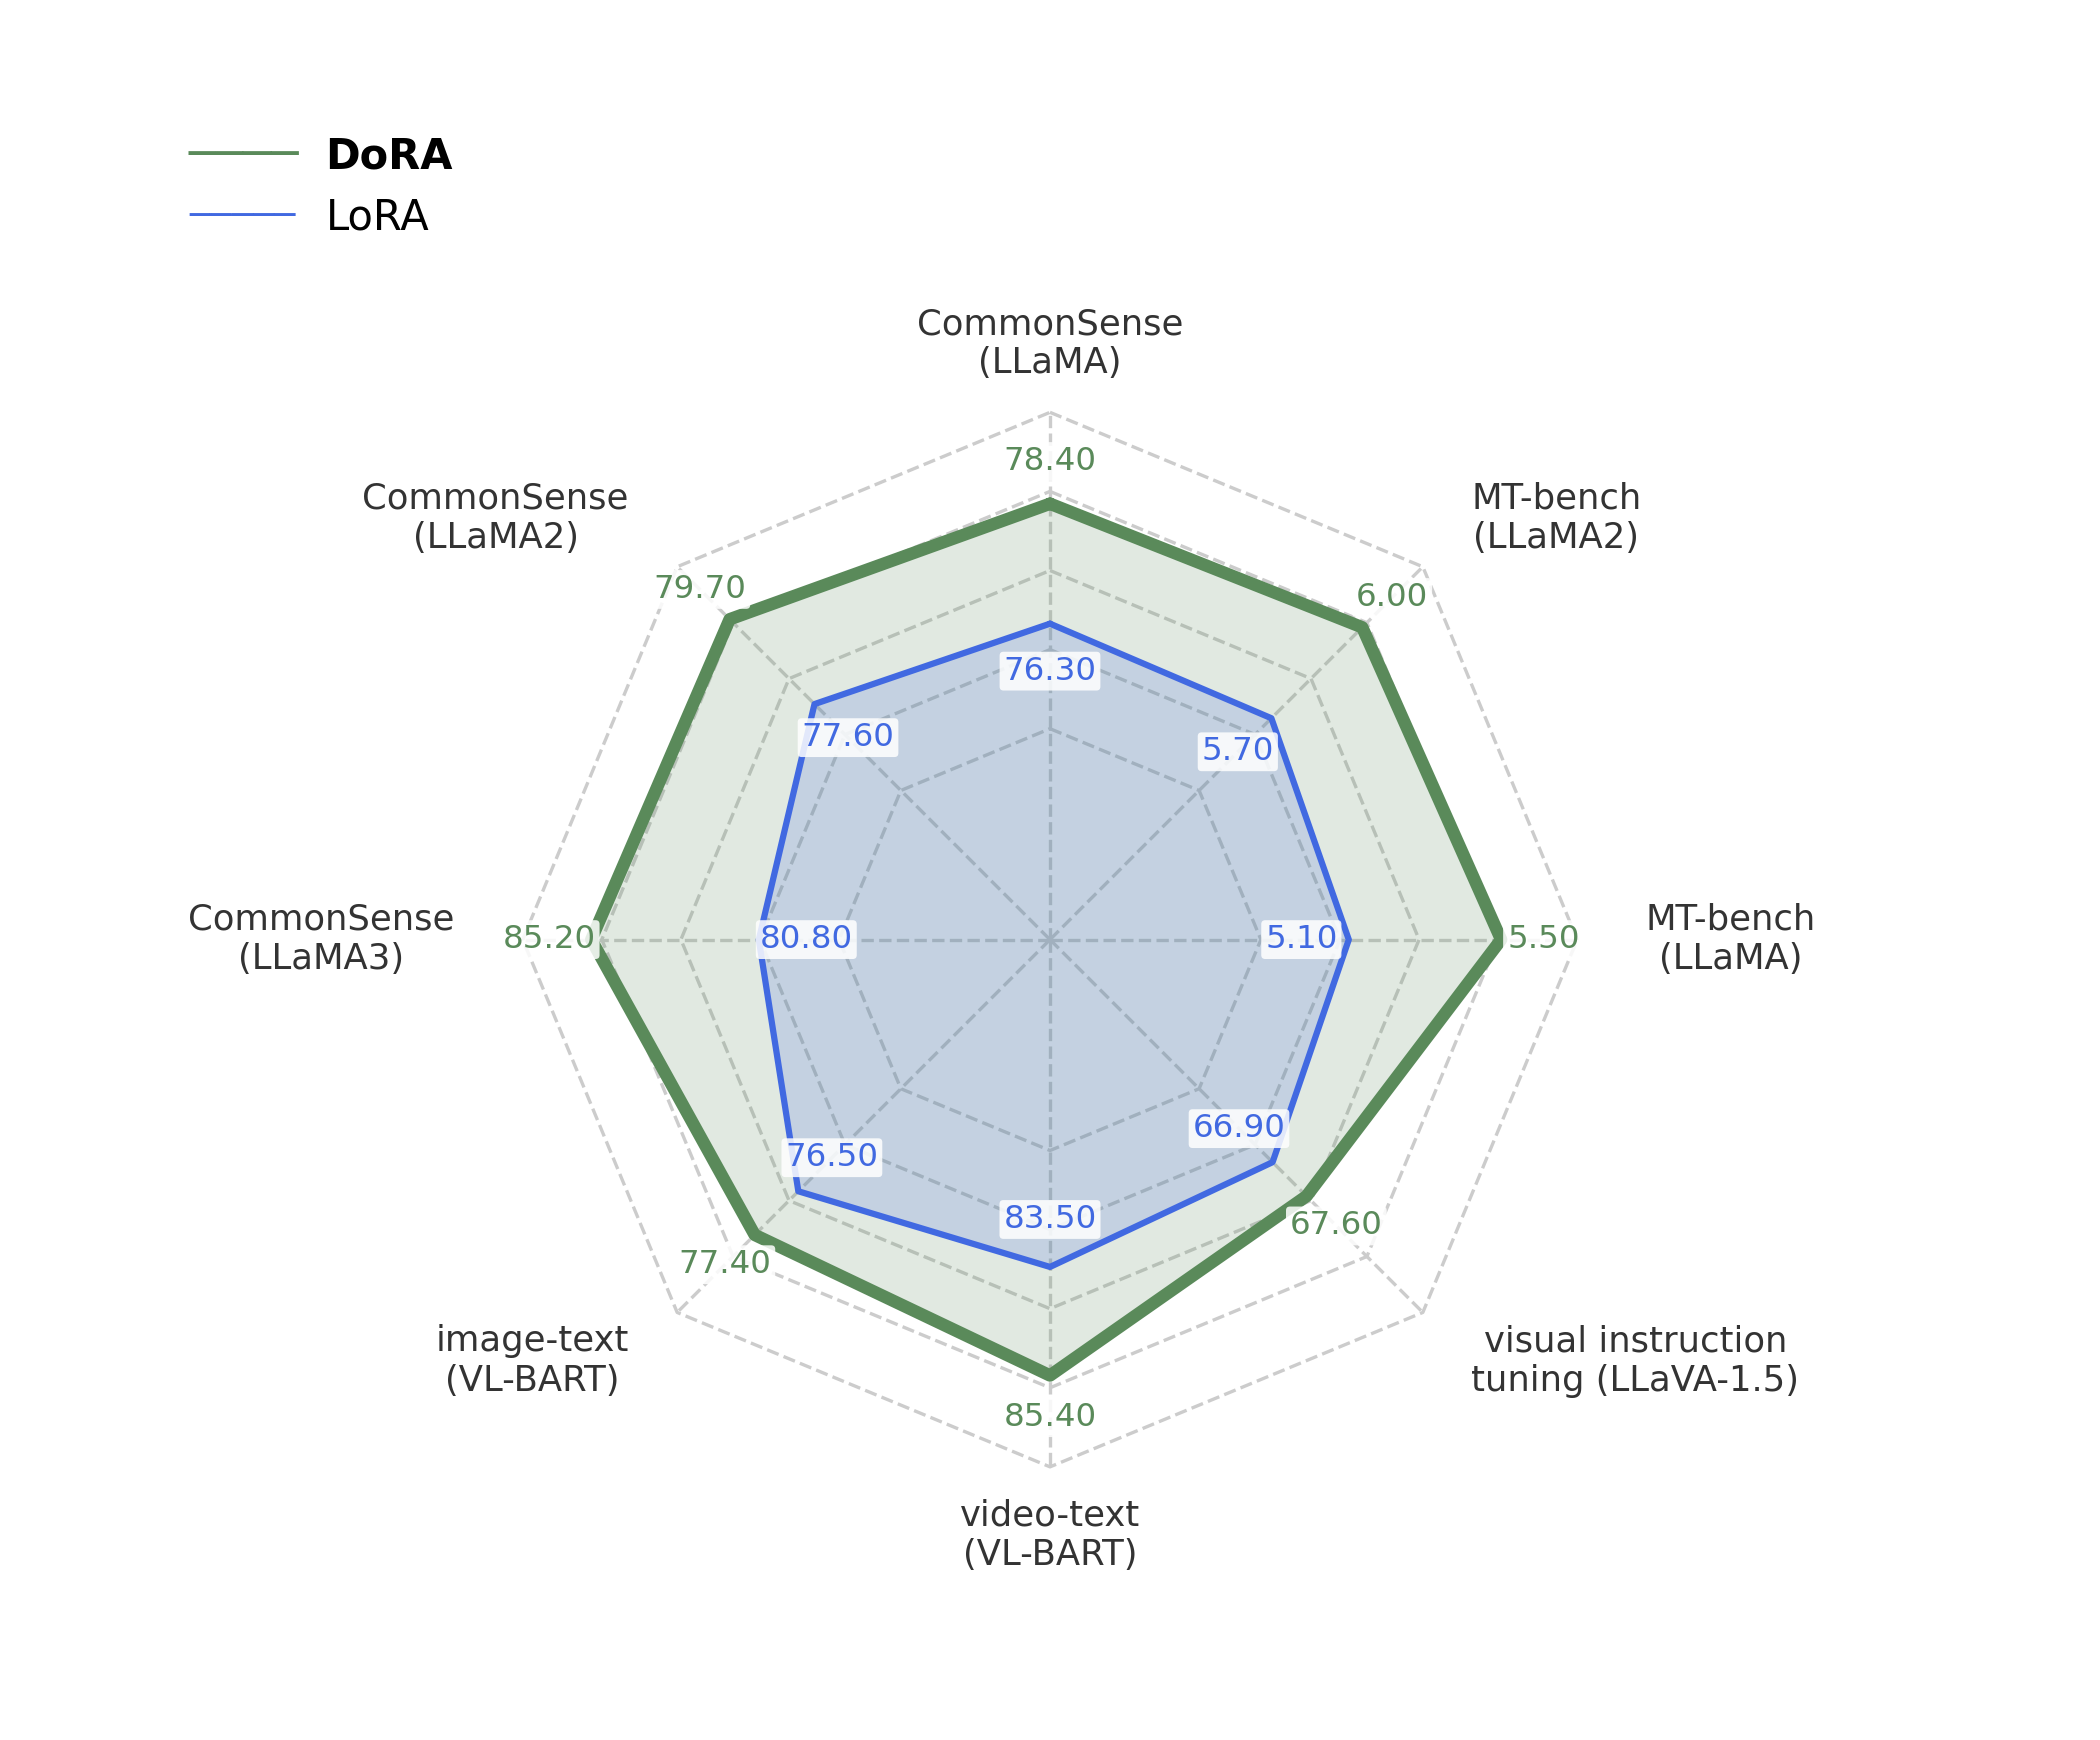 radar_dora.pyRadar / Polar雷达图 / 极坐标
DoRA · 8-axis radar comparison vs LoRA
DoRA · 8 轴雷达图对比 LoRA
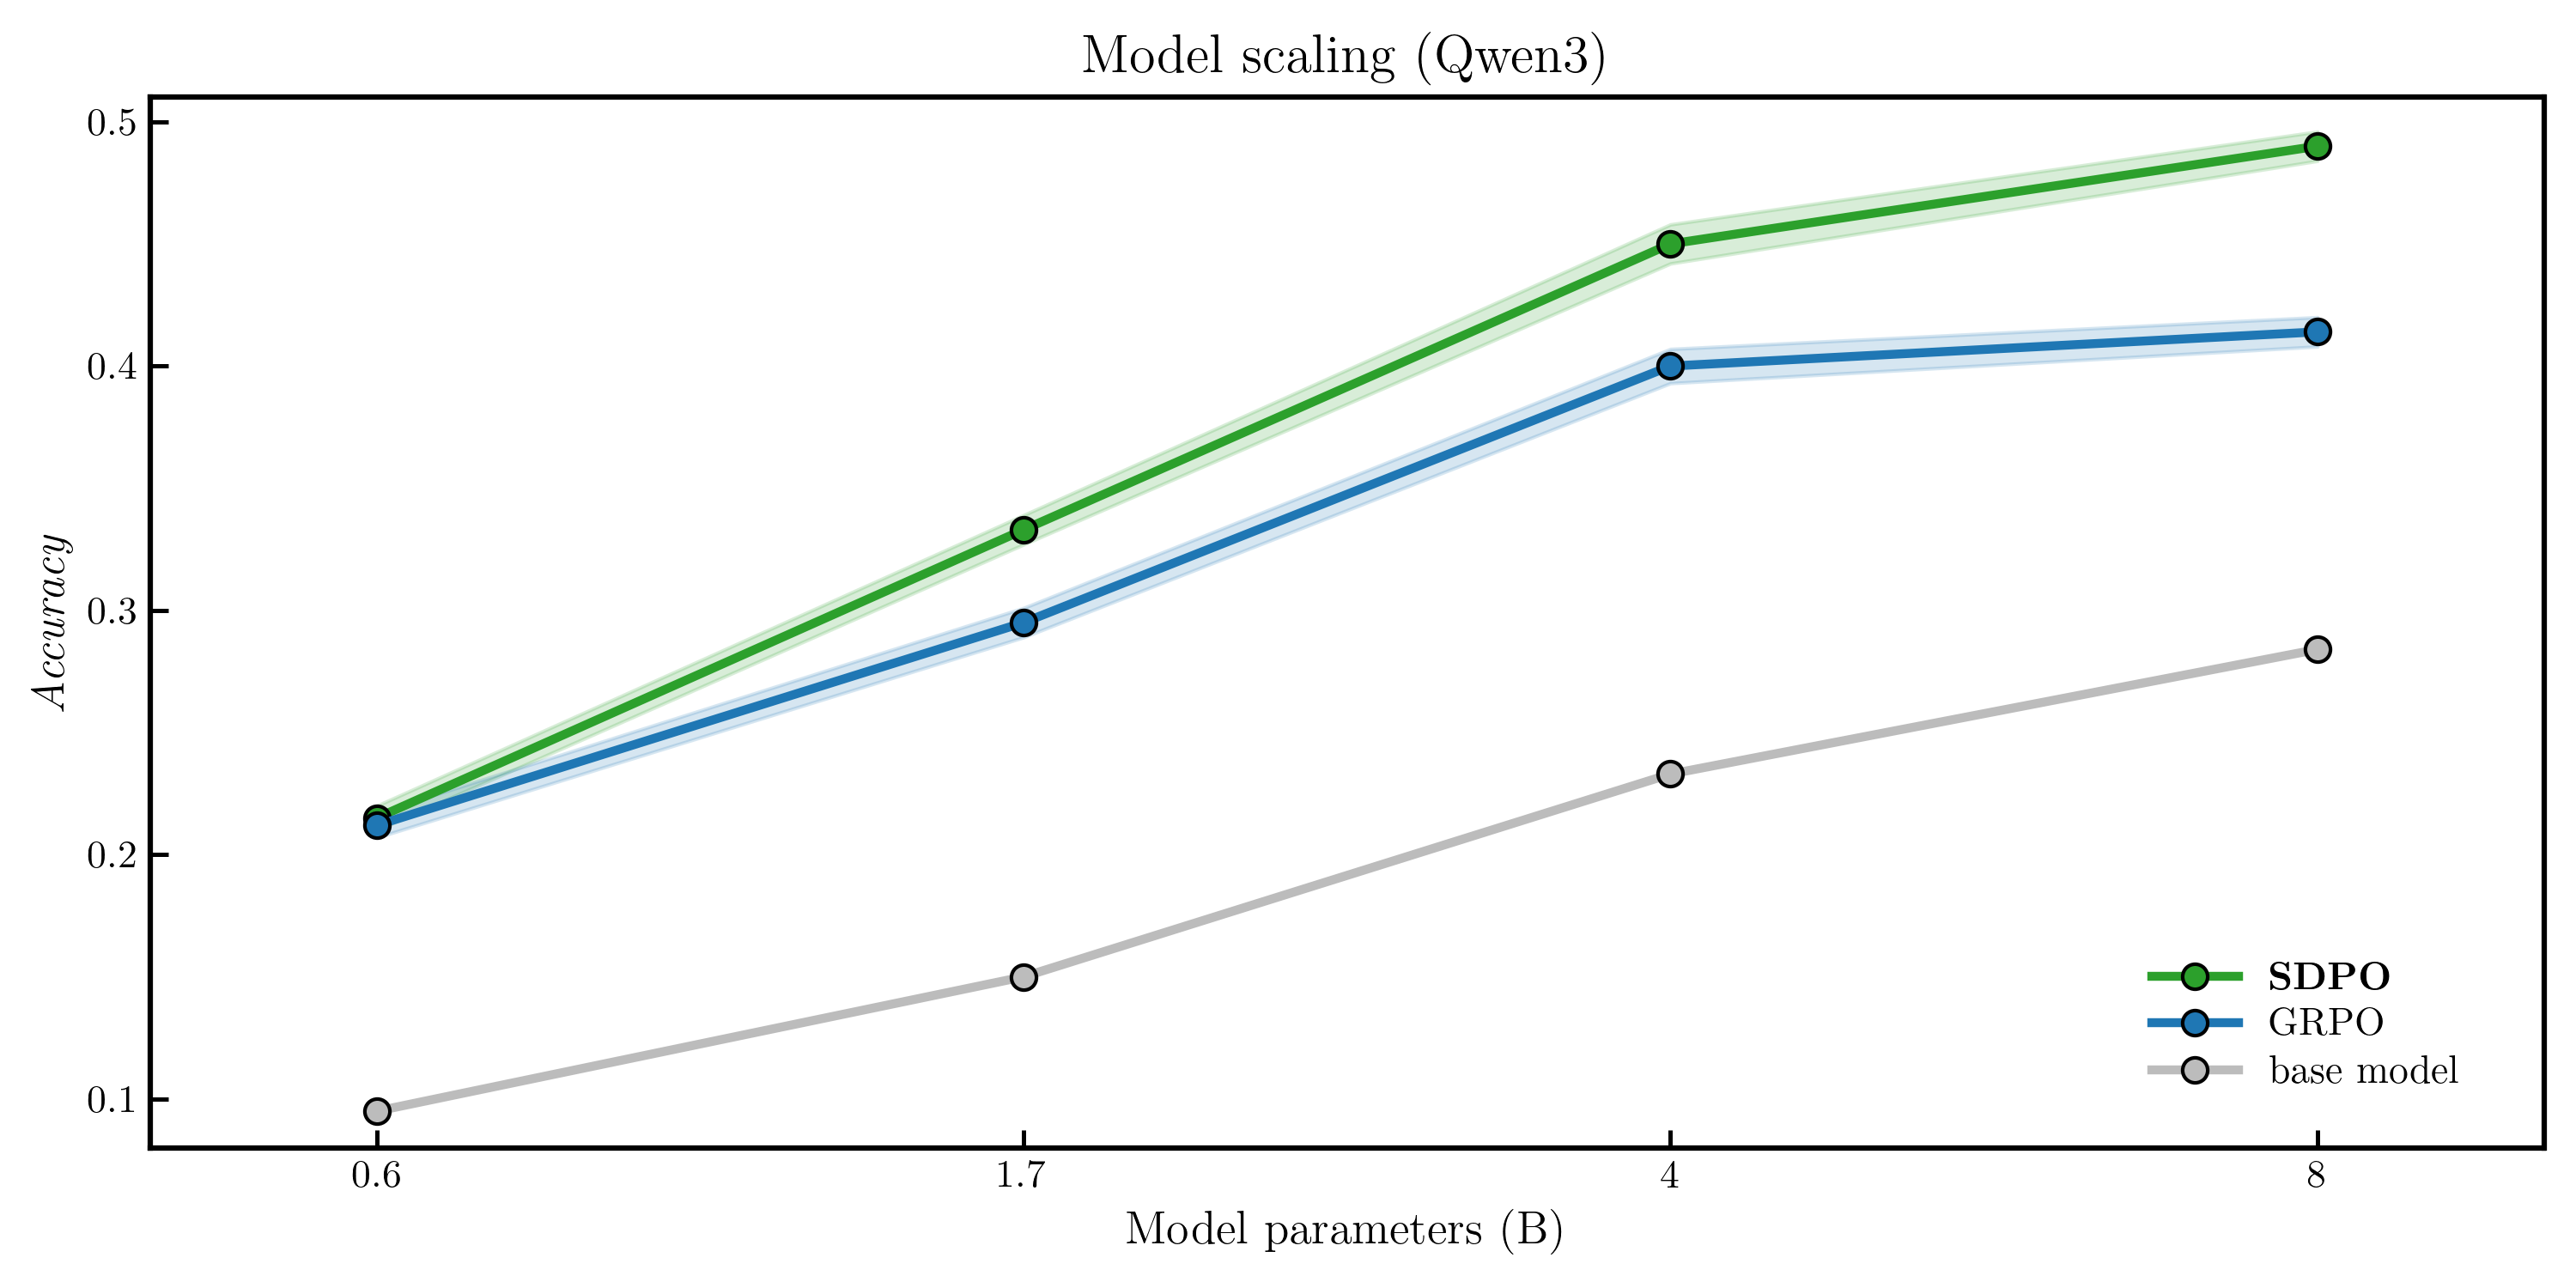 line_selfdistill_scale.pyLine Chart折线图
Self-Distillation · Qwen3 model-scaling curve with confidence band
Self-Distillation · Qwen3 模型规模 scaling 折线
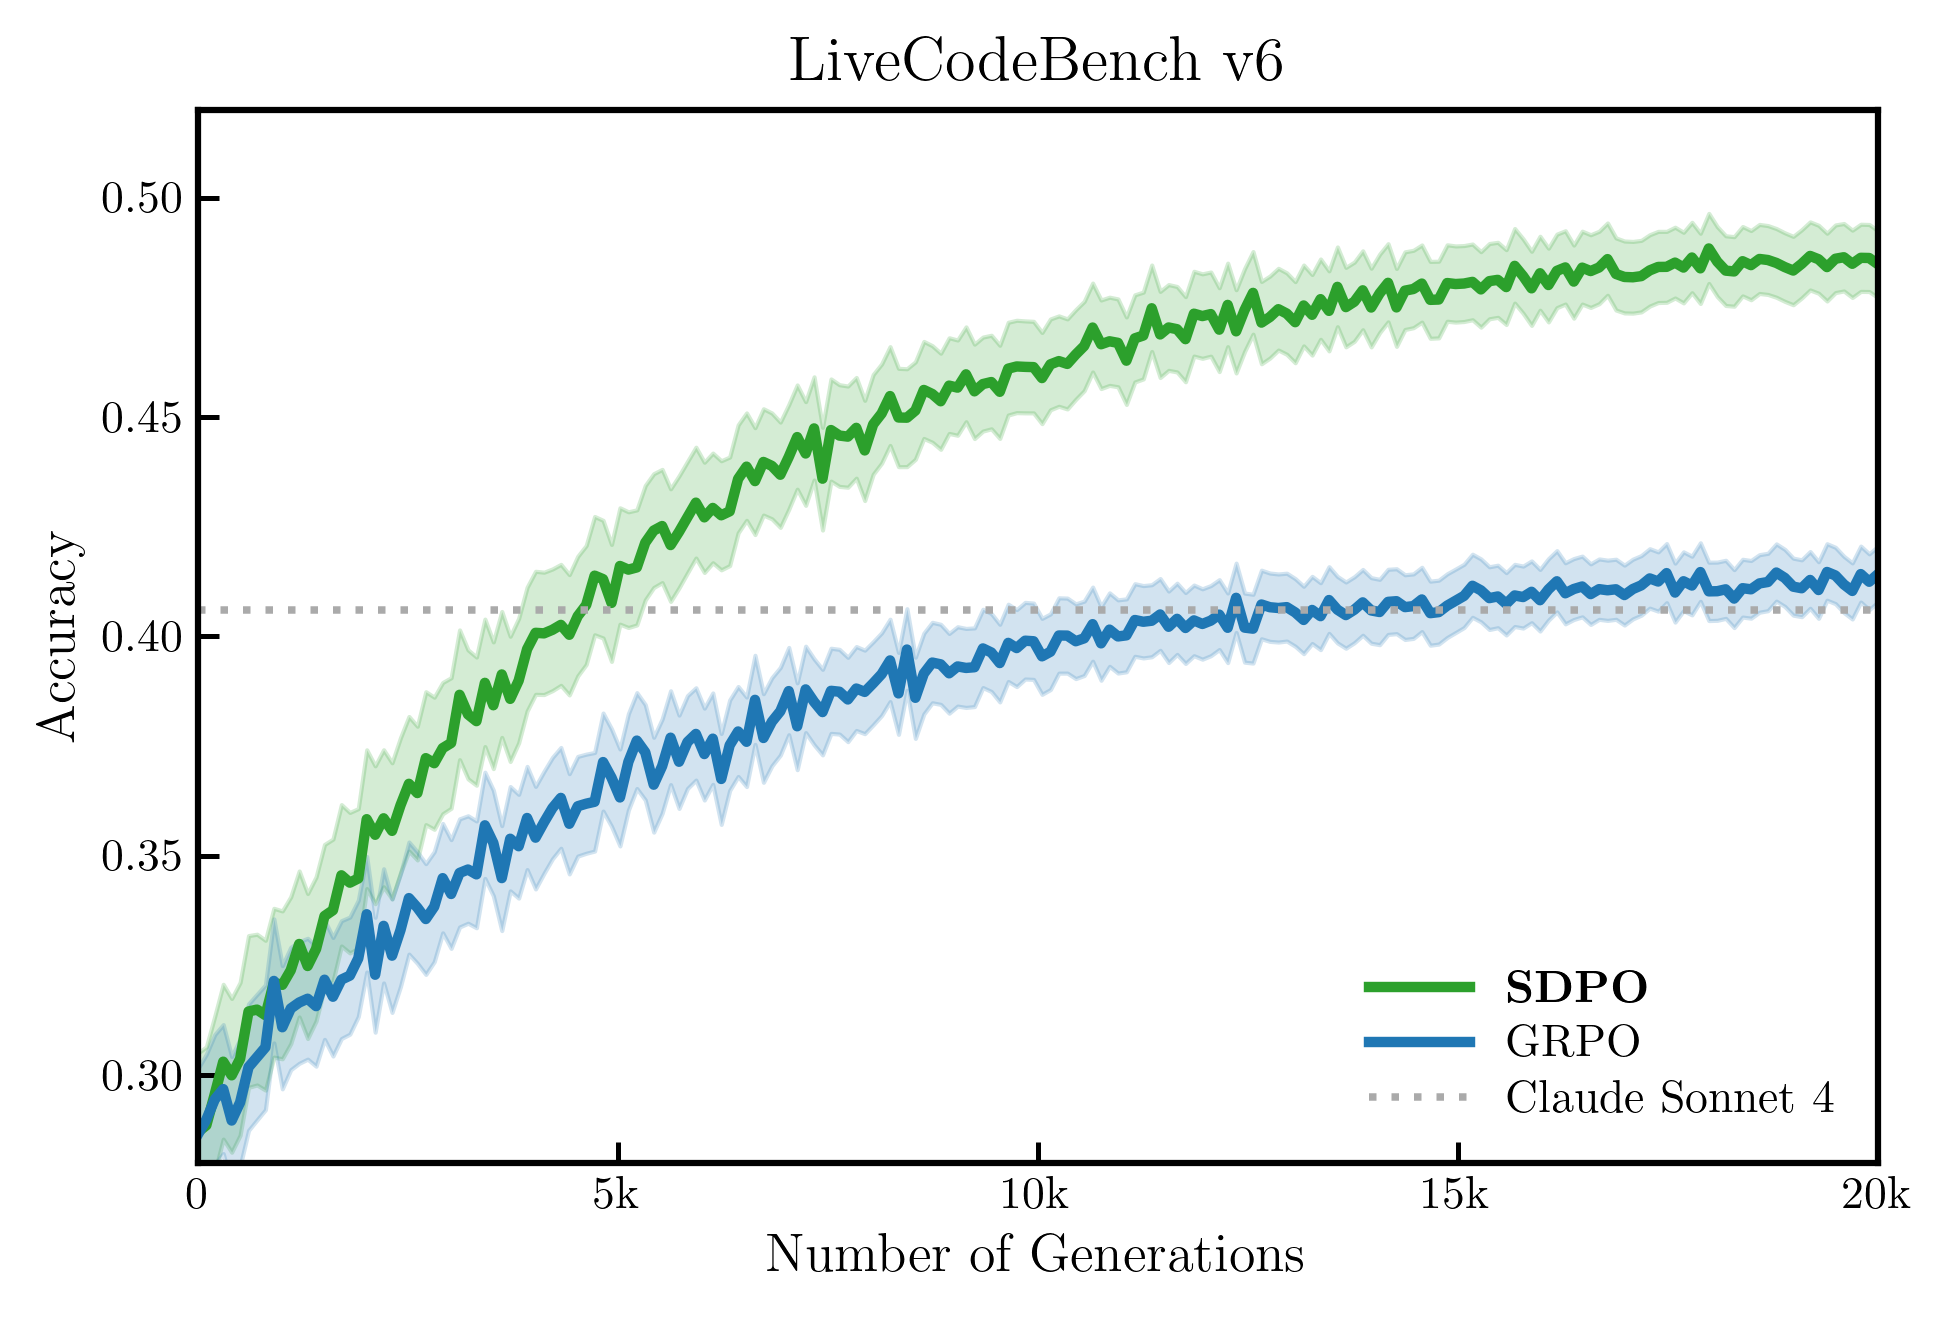 line_selfdistill_train.pyLine Chart折线图
Self-Distillation · LiveCodeBench training curve with confidence band
Self-Distillation · LiveCodeBench 训练曲线 + 置信区间阴影
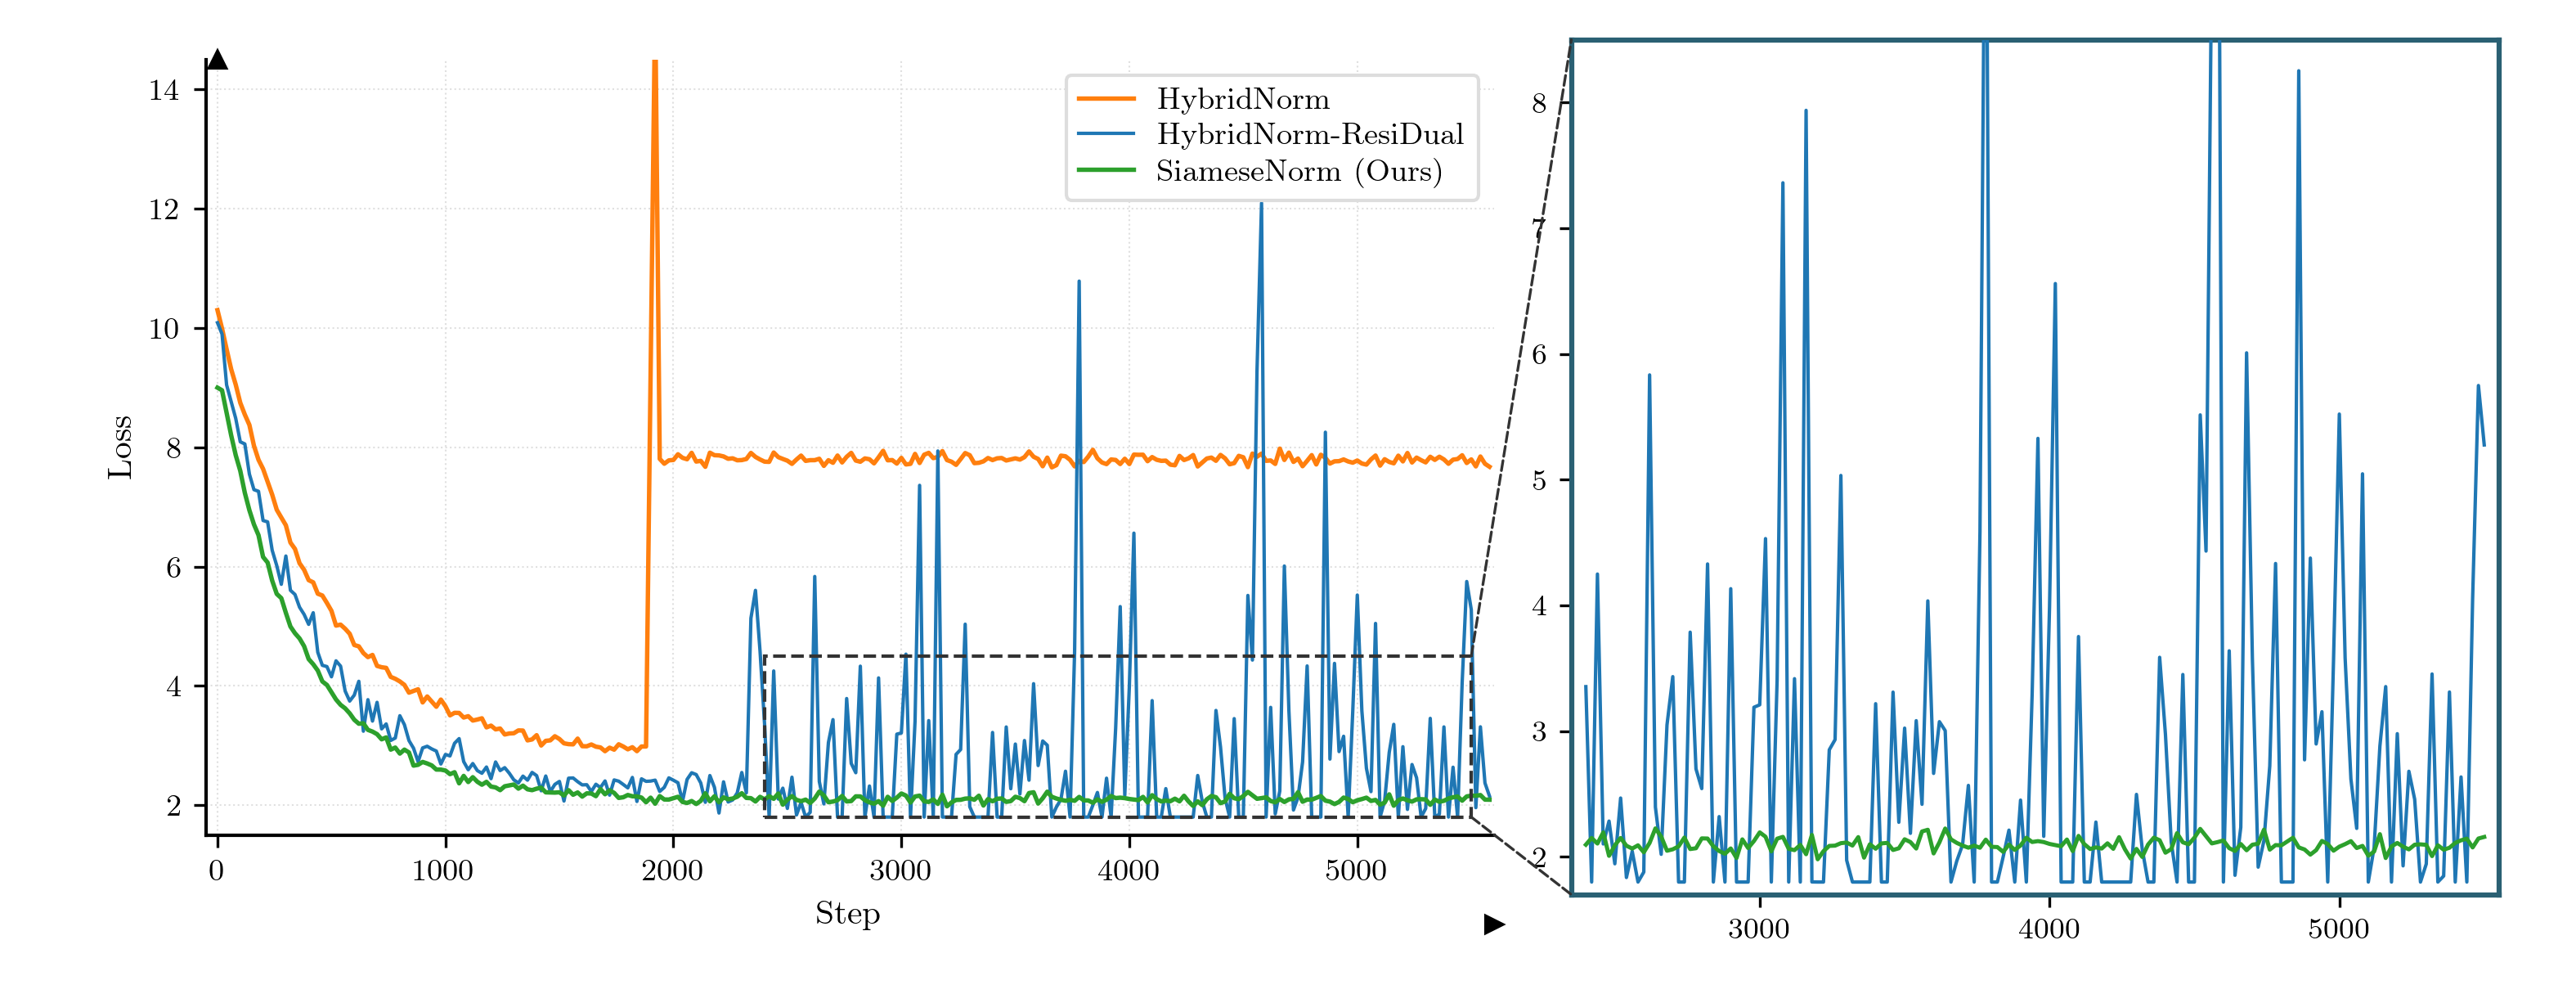 line_loss_inset.pyLine Chart折线图
SiameseNorm · Loss curve with arrow axes and zoom inset
SiameseNorm · L 形 spine 损失曲线 + 局部放大子图
 line_aime.pyLine Chart折线图
DAPO · AIME training curve with vertical breakpoints
DAPO · AIME 训练曲线 + 垂直断点线
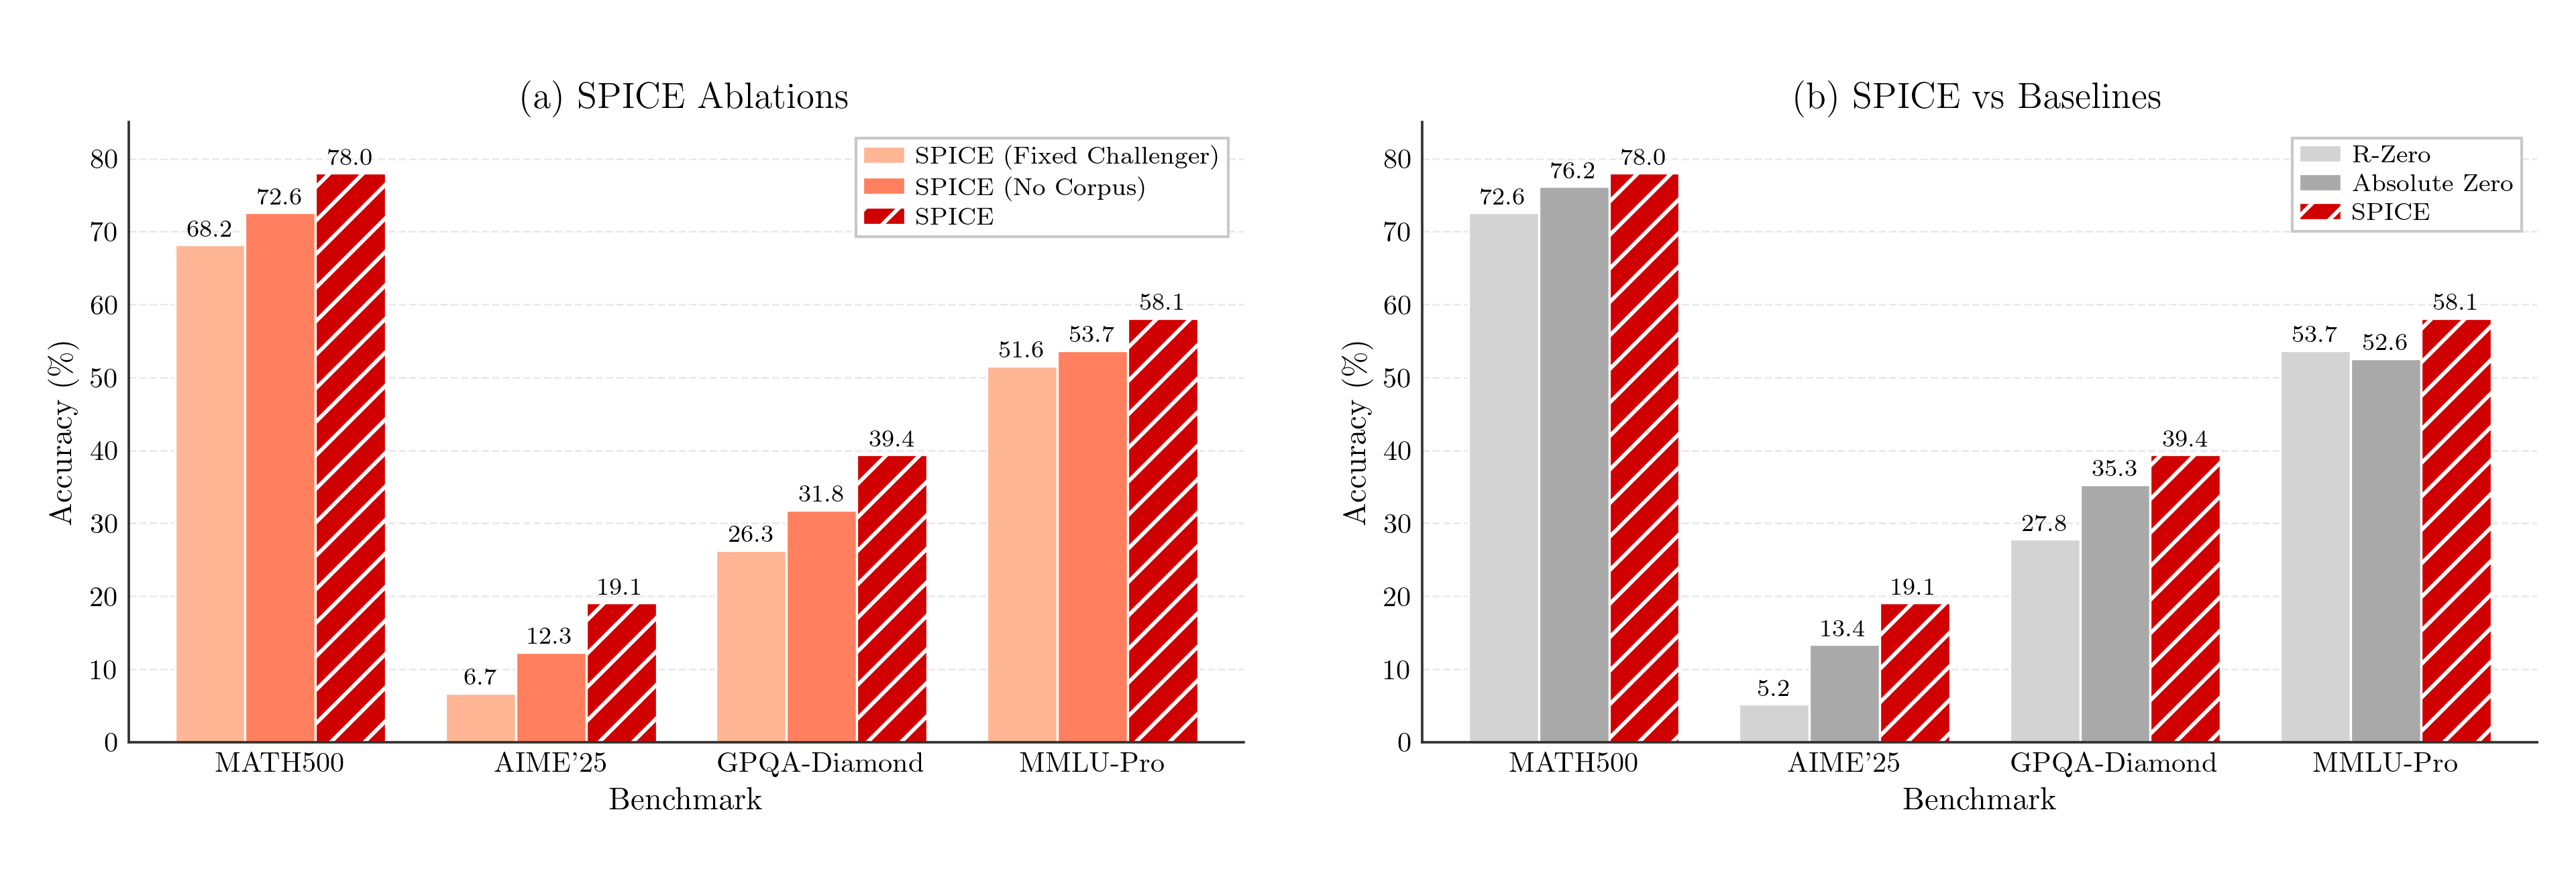 bar_spice.pyBar Chart柱状图
SPICE · Grouped bars with white hatch on the main method
SPICE · 分组柱 + 主方法斜线填充
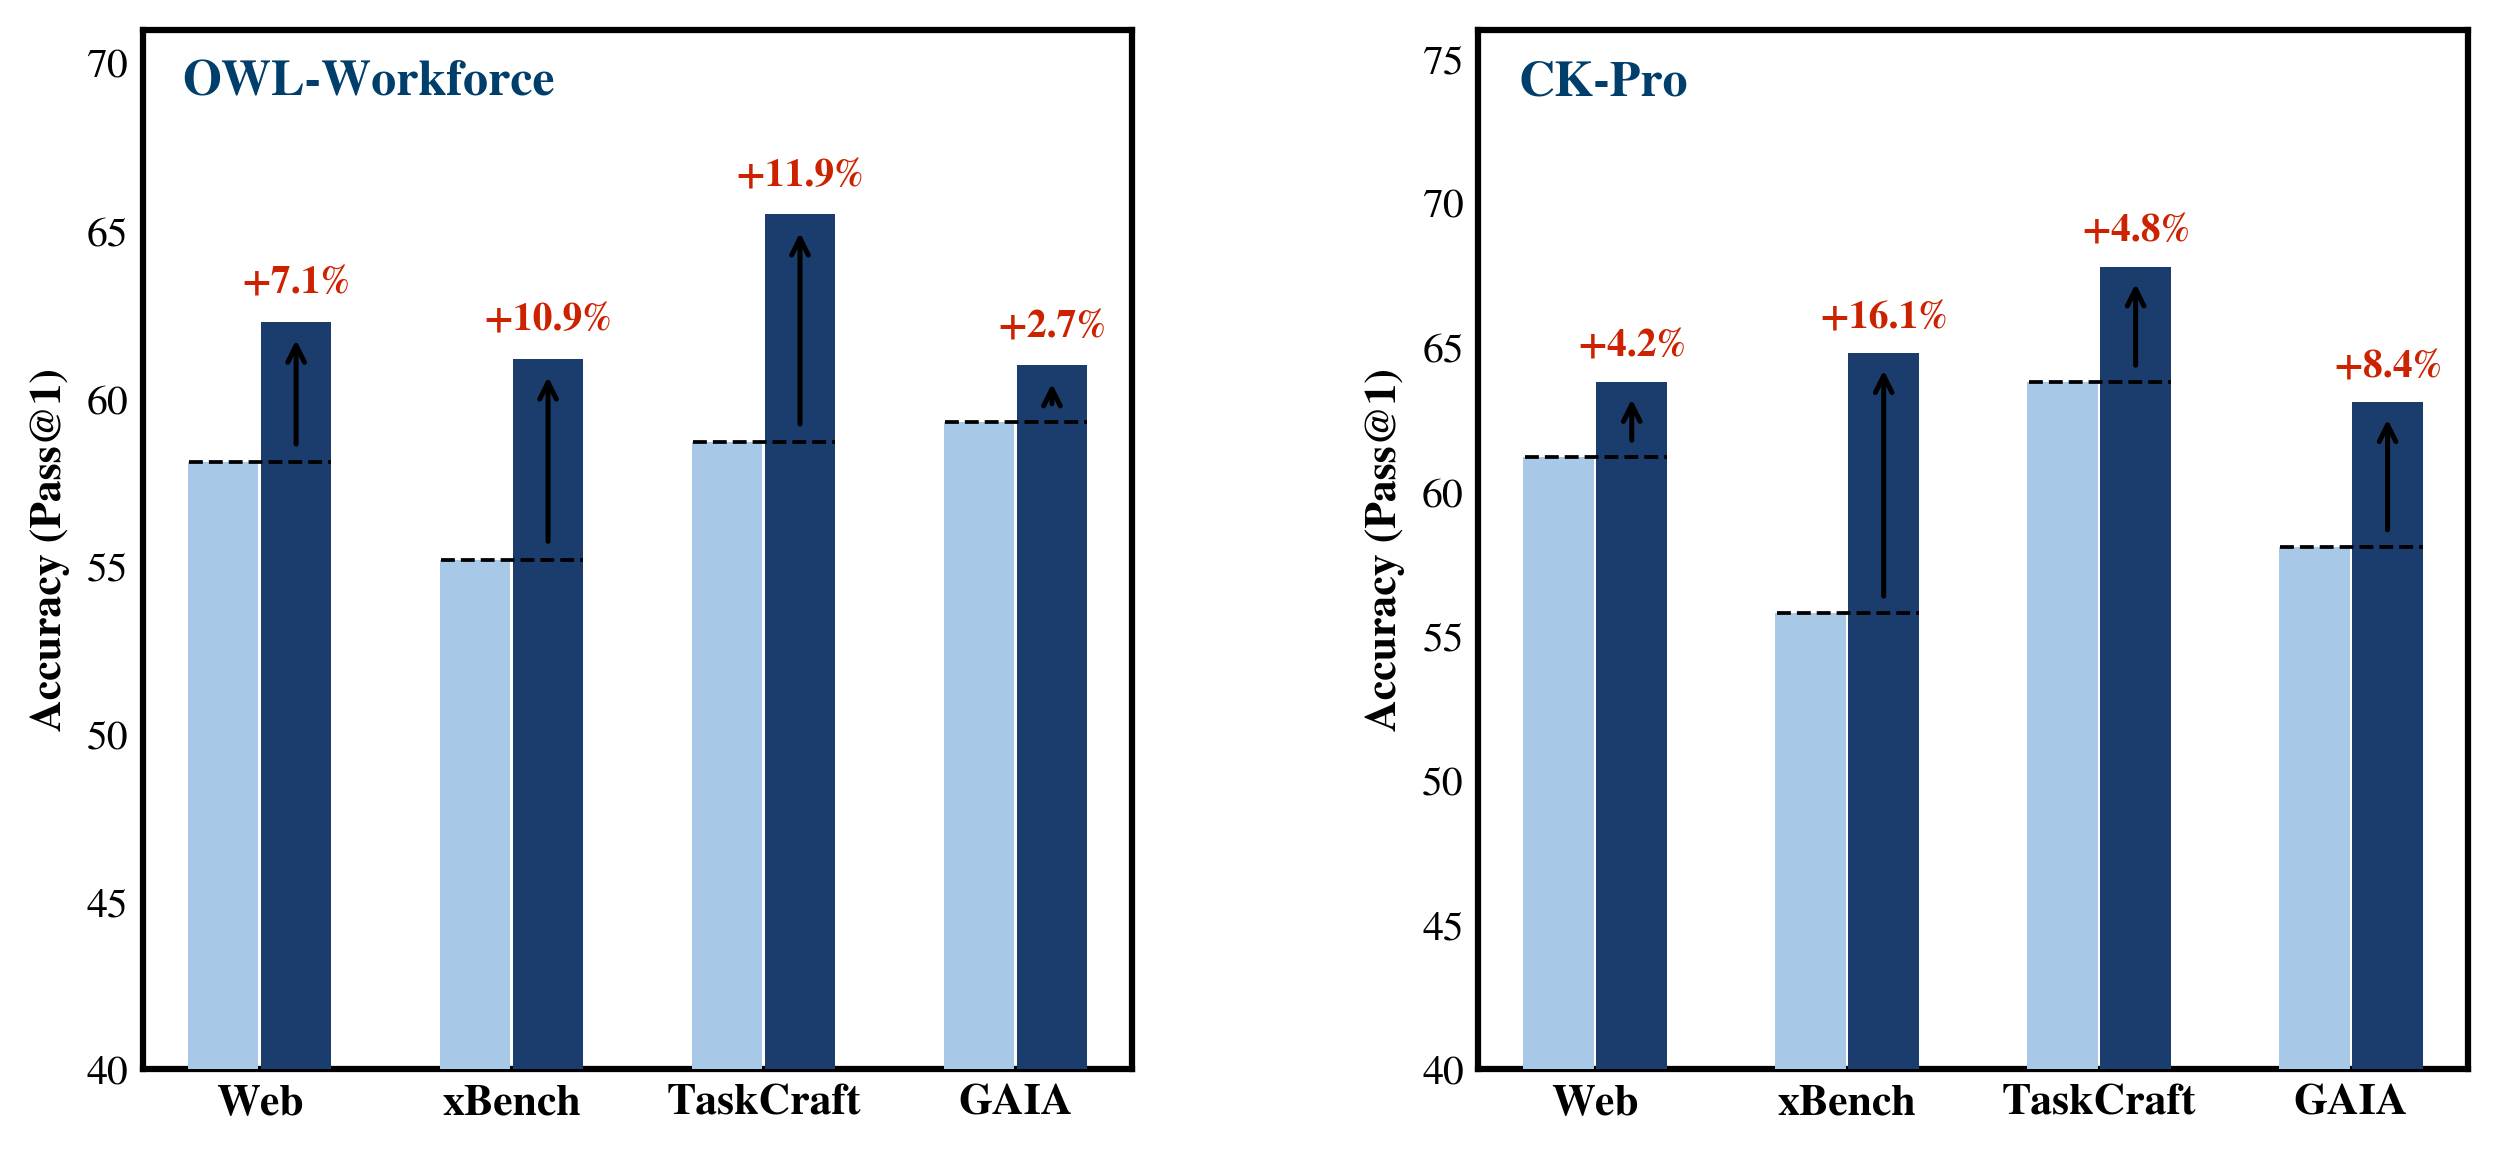 bar_memevolve.pyBar Chart柱状图
MemEvolve · Paired baseline-vs-method bars with delta arrows
MemEvolve · 配对柱 + 增益箭头