Bar Chart · 柱状图#paired-bar#category-colours#reference-line#many-models#tilted-labels
PHYBench · 19-model paired bars with category colours and human reference lines
PHYBench · 19 模型配对柱(Acc + EED)+ 类别配色 + 人类参考线
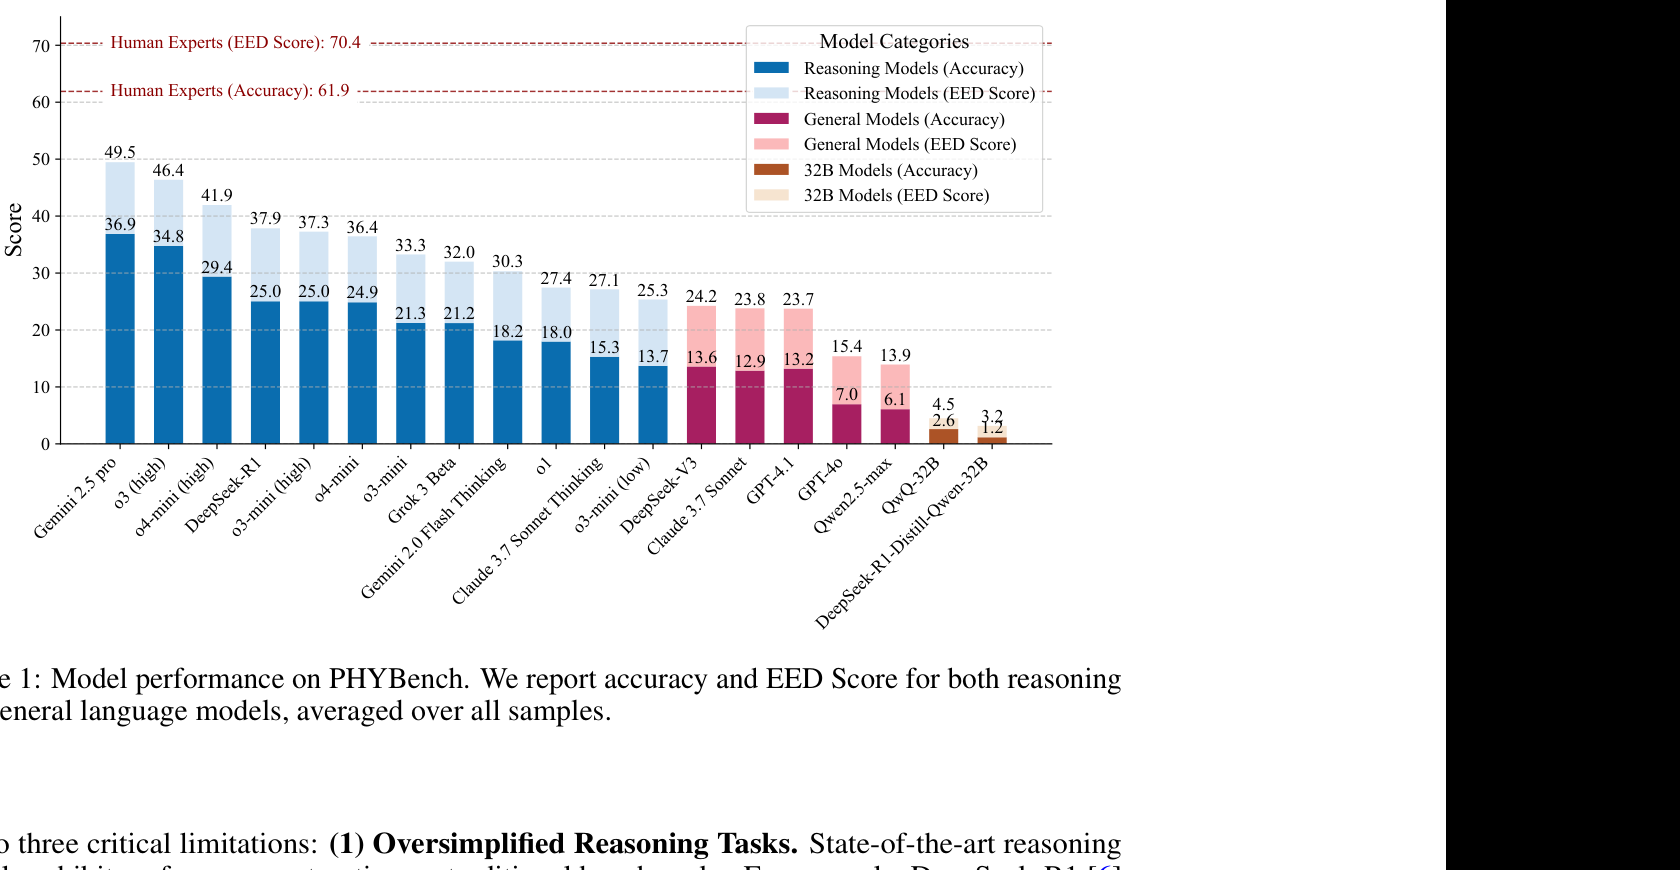
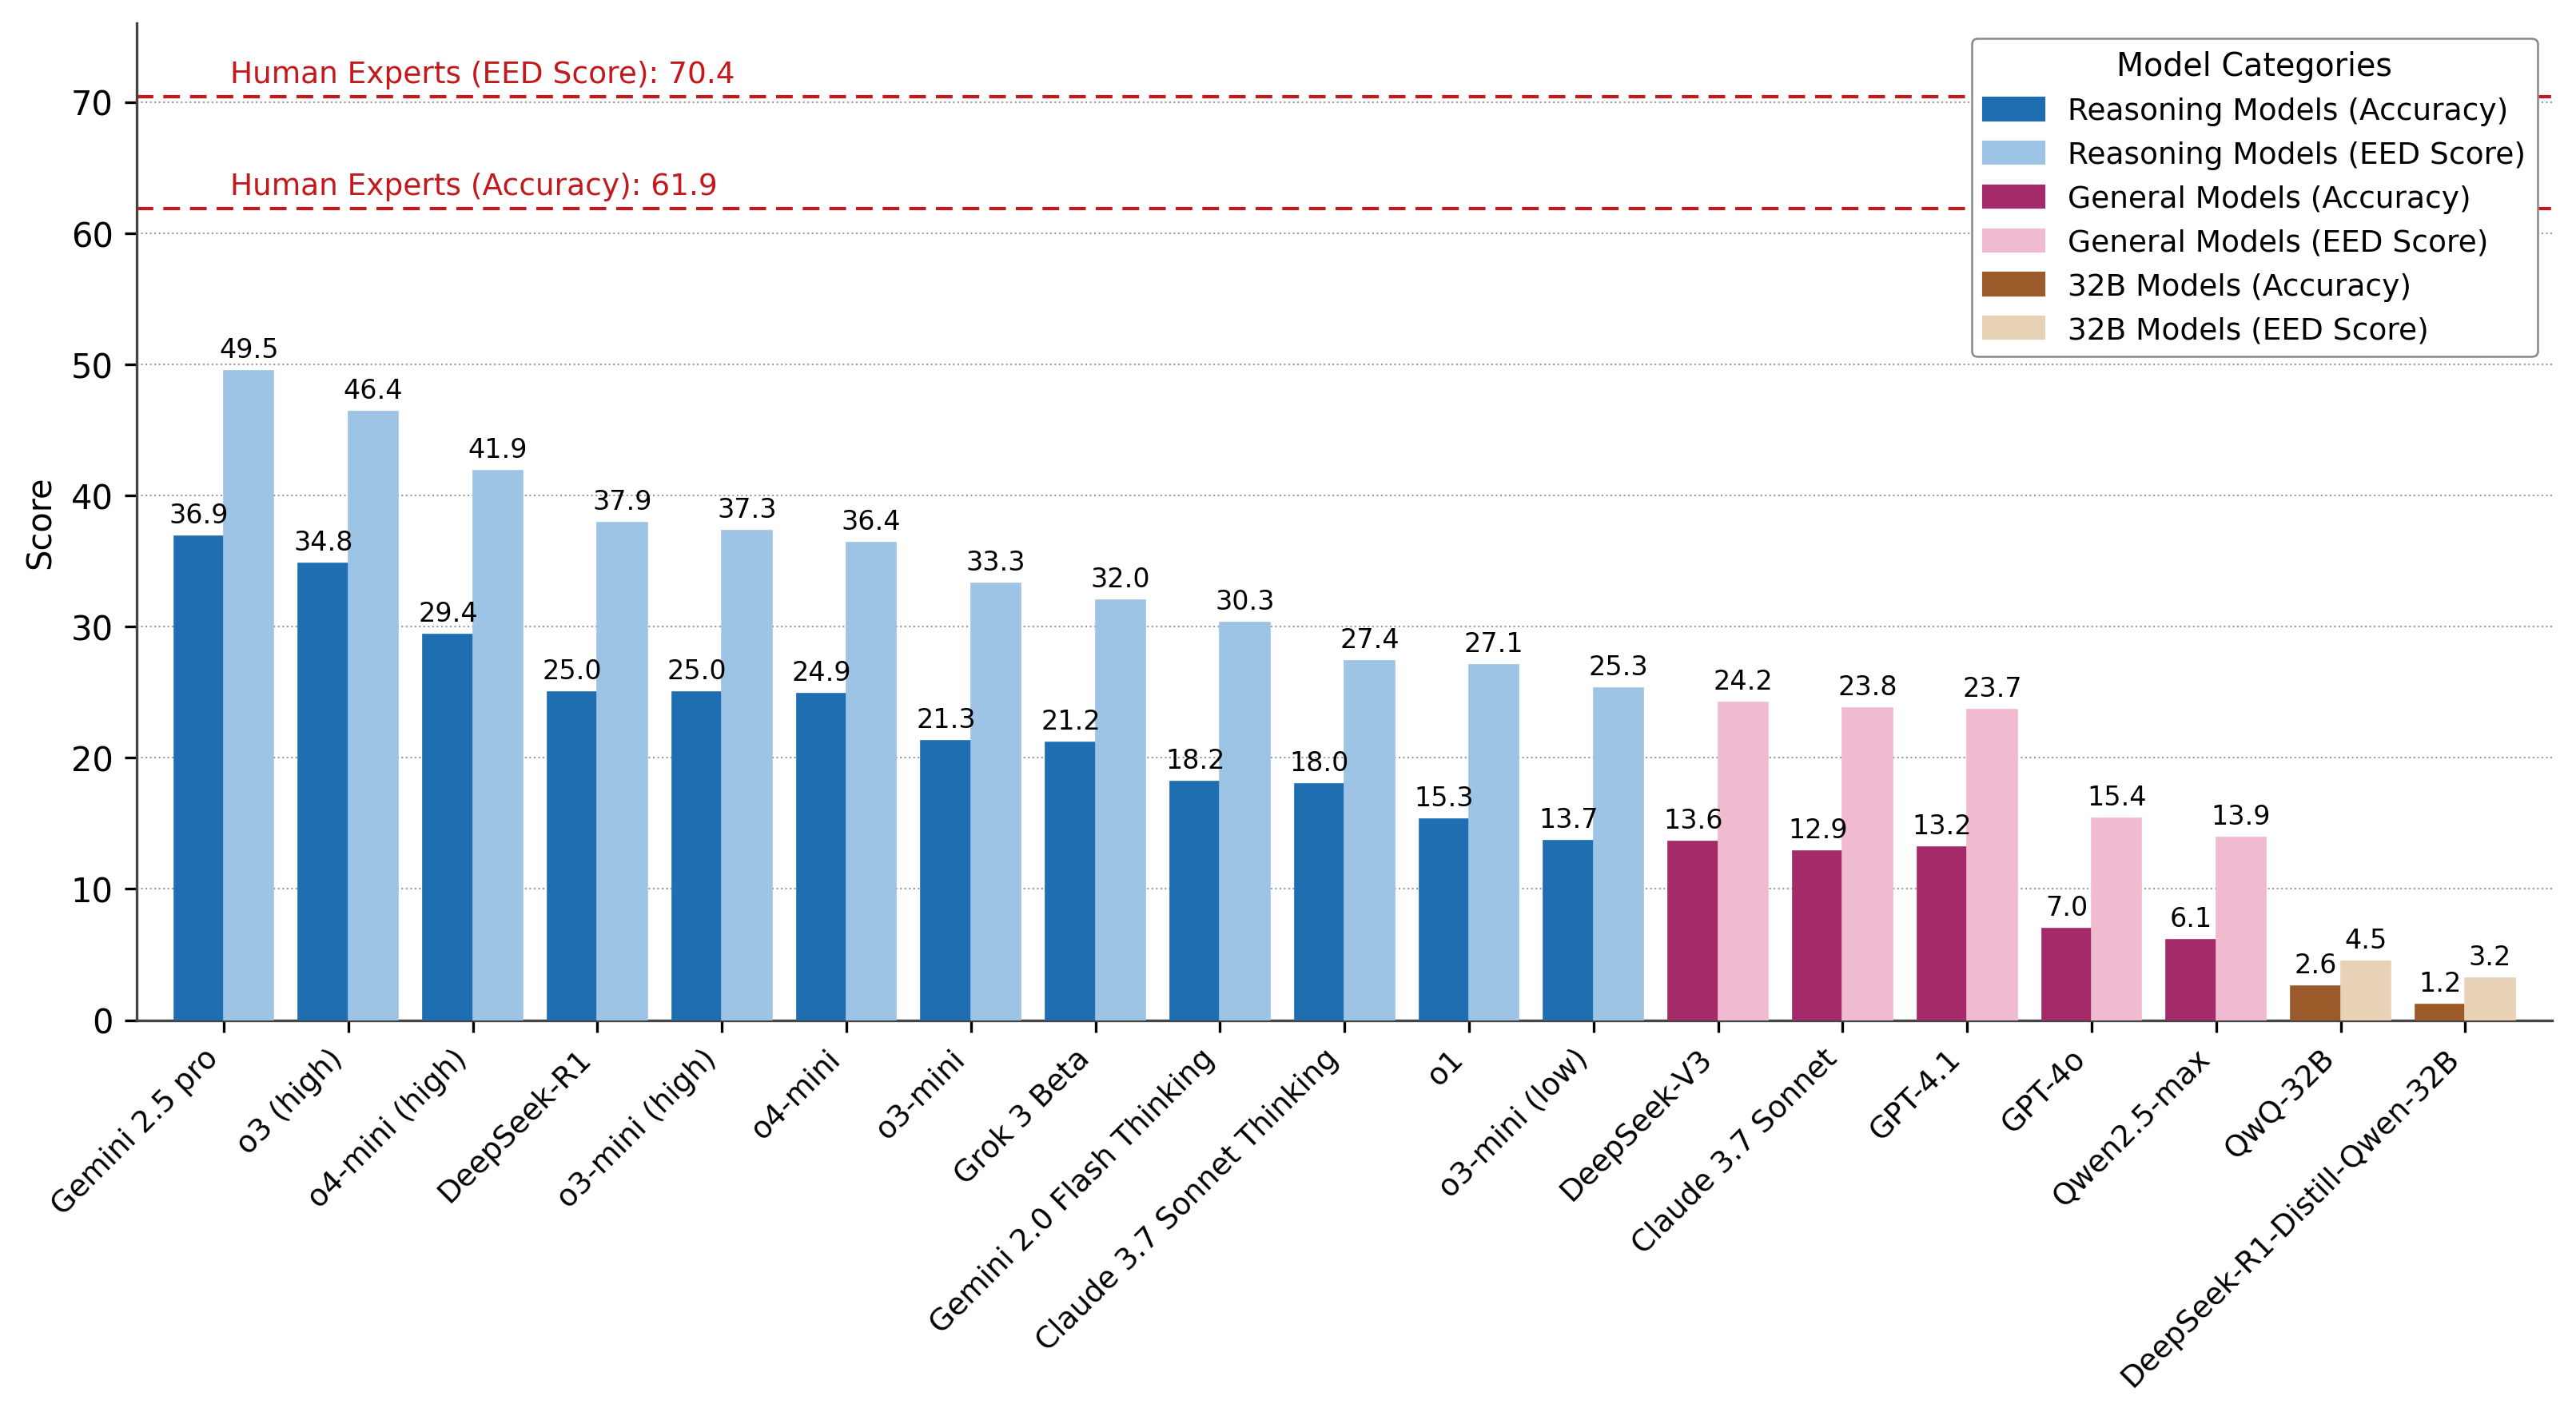
Reproduction of PHYBench Figure 1. For each of 19 LLMs the bar chart shows Accuracy (darker) and EED Score (lighter) side-by-side, with three category colour families: Reasoning Models (blue), General Models (maroon/pink) and 32B Models (brown). Two red dashed horizontal lines mark the human-expert Accuracy (61.9) and EED (70.4). Numeric labels above every bar; tilted x-axis labels.
PHYBench Figure 1 复现。19 个 LLM,每个并排显示 Accuracy(深色)和 EED Score(浅色),分三个色系:推理模型(蓝)、通用模型(暗红/粉)、32B 模型(棕)。两条红虚线水平参考人类专家 Accuracy(61.9)和 EED(70.4)。每根柱顶有数值标签,x 轴标签倾斜。
@paper · 来自论文
PHYBench: Holistic Evaluation of Physical Perception and Reasoning in Large Language Models
PHYBench:大语言模型物理感知与推理的整体评测
Shi Qiu et al. (Peking University) · arXiv 2025
// original from paper · 论文原图
// reproduced via phybench_model_perf.py · 脚本复现download png
phybench_model_perf.py
"""PHYBench · Per-model paired bars with category-coded colours and human reference lines.

Reproduction of PHYBench Figure 1 (Model performance on PHYBench).
Source: PHYBench: Holistic Evaluation of Physical Perception and Reasoning
in Large Language Models, arXiv:2504.16074.

Each model is shown as a pair of side-by-side bars (Accuracy = darker,
EED Score = lighter). Models are coloured by category:
  - Reasoning Models : blue / light blue
  - General Models   : maroon / pink
  - 32B Models       : brown / tan
Two red dashed horizontal lines mark the human-expert baselines.
"""

import matplotlib.pyplot as plt
import numpy as np

plt.rcParams.update({
    "font.family": "sans-serif",
    "font.sans-serif": ["DejaVu Sans", "Arial"],
})

REASONING_DARK = "#1F6EB1"
REASONING_LIGHT = "#9DC4E5"
GENERAL_DARK = "#A52A6A"
GENERAL_LIGHT = "#F0BAD0"
LRM32_DARK = "#9C5A2B"
LRM32_LIGHT = "#E8D2B6"
HUMAN_LINE = "#C4191C"

MODELS = [
    ("Gemini 2.5 pro",                36.9, 49.5, "reasoning"),
    ("o3 (high)",                     34.8, 46.4, "reasoning"),
    ("o4-mini (high)",                29.4, 41.9, "reasoning"),
    ("DeepSeek-R1",                   25.0, 37.9, "reasoning"),
    ("o3-mini (high)",                25.0, 37.3, "reasoning"),
    ("o4-mini",                       24.9, 36.4, "reasoning"),
    ("o3-mini",                       21.3, 33.3, "reasoning"),
    ("Grok 3 Beta",                   21.2, 32.0, "reasoning"),
    ("Gemini 2.0 Flash Thinking",     18.2, 30.3, "reasoning"),
    ("Claude 3.7 Sonnet Thinking",    18.0, 27.4, "reasoning"),
    ("o1",                            15.3, 27.1, "reasoning"),
    ("o3-mini (low)",                 13.7, 25.3, "reasoning"),
    ("DeepSeek-V3",                   13.6, 24.2, "general"),
    ("Claude 3.7 Sonnet",             12.9, 23.8, "general"),
    ("GPT-4.1",                       13.2, 23.7, "general"),
    ("GPT-4o",                         7.0, 15.4, "general"),
    ("Qwen2.5-max",                    6.1, 13.9, "general"),
    ("QwQ-32B",                        2.6,  4.5, "lrm32"),
    ("DeepSeek-R1-Distill-Qwen-32B",   1.2,  3.2, "lrm32"),
]

CAT_COLORS = {
    "reasoning": (REASONING_DARK, REASONING_LIGHT),
    "general":   (GENERAL_DARK, GENERAL_LIGHT),
    "lrm32":     (LRM32_DARK, LRM32_LIGHT),
}

names = [m[0] for m in MODELS]
acc = np.array([m[1] for m in MODELS])
eed = np.array([m[2] for m in MODELS])
cats = [m[3] for m in MODELS]
n = len(names)

fig, ax = plt.subplots(figsize=(13, 5.4))

x = np.arange(n)
W = 0.4

for i, c in enumerate(cats):
    dark, light = CAT_COLORS[c]
    ax.bar(x[i] - W / 2, acc[i], width=W, color=dark,
           edgecolor=dark, linewidth=0.4, zorder=3)
    ax.bar(x[i] + W / 2, eed[i], width=W, color=light,
           edgecolor=light, linewidth=0.4, zorder=3)

    ax.text(x[i] - W / 2, acc[i] + 0.6, f"{acc[i]:.1f}",
            ha="center", va="bottom", fontsize=8, color="black")
    ax.text(x[i] + W / 2, eed[i] + 0.6, f"{eed[i]:.1f}",
            ha="center", va="bottom", fontsize=8, color="black")

ax.axhline(70.4, color=HUMAN_LINE, lw=1.0, ls=(0, (5, 3)), zorder=2)
ax.axhline(61.9, color=HUMAN_LINE, lw=1.0, ls=(0, (5, 3)), zorder=2)

ax.text(0.05, 70.4 + 0.6, "Human Experts (EED Score): 70.4",
        color=HUMAN_LINE, fontsize=9, fontweight="normal", va="bottom")
ax.text(0.05, 61.9 + 0.6, "Human Experts (Accuracy): 61.9",
        color=HUMAN_LINE, fontsize=9, fontweight="normal", va="bottom")

ax.set_ylim(0, 76)
ax.yaxis.set_major_locator(plt.MultipleLocator(10))
ax.set_ylabel("Score", fontsize=10)

ax.set_xticks(x)
ax.set_xticklabels(names, rotation=45, ha="right", fontsize=9)

ax.set_xlim(-0.7, n - 0.3)
ax.grid(axis="y", ls=":", lw=0.5, color="#999", zorder=0)
ax.set_axisbelow(True)
for sp in ("top", "right"):
    ax.spines[sp].set_visible(False)
for sp in ("left", "bottom"):
    ax.spines[sp].set_color("#444")

handles = [
    plt.Rectangle((0, 0), 1, 1, color=REASONING_DARK,  label="Reasoning Models (Accuracy)"),
    plt.Rectangle((0, 0), 1, 1, color=REASONING_LIGHT, label="Reasoning Models (EED Score)"),
    plt.Rectangle((0, 0), 1, 1, color=GENERAL_DARK,    label="General Models (Accuracy)"),
    plt.Rectangle((0, 0), 1, 1, color=GENERAL_LIGHT,   label="General Models (EED Score)"),
    plt.Rectangle((0, 0), 1, 1, color=LRM32_DARK,      label="32B Models (Accuracy)"),
    plt.Rectangle((0, 0), 1, 1, color=LRM32_LIGHT,     label="32B Models (EED Score)"),
]
leg = ax.legend(handles=handles, loc="upper right", title="Model Categories",
                fontsize=9, title_fontsize=9.5, framealpha=1.0,
                edgecolor="#888")
leg.get_frame().set_linewidth(0.6)

plt.savefig("phybench_model_perf.png", dpi=300, bbox_inches="tight",
            facecolor="white")
plt.close()
print("saved: phybench_model_perf.png")