Scatter Plot · 散点图#t-sne#annotation-box#latex#dotted-grid
MemGen · t-SNE latent-memory clusters with rounded annotation pills
MemGen · t-SNE 隐空间记忆聚类 + 圆角注释胶囊
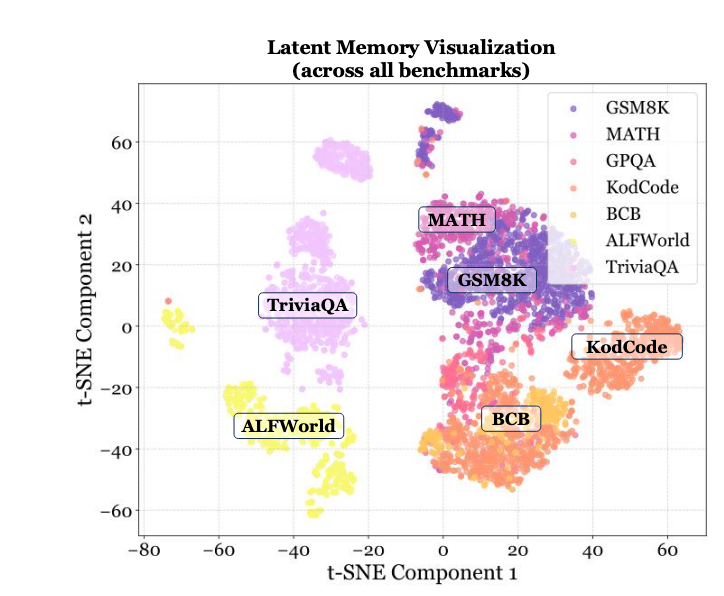
Seven dataset clusters plotted as a t-SNE blob. Each cluster has a rounded annotation pill placed at its centre, with a unified dark-slate edge (#2C3E50) and a translucent face colour matched to the cluster. Light dotted grey grid, dark four-side spine, ticks pointing inward, LaTeX serif title with a line break.
7 个数据集的 t-SNE 聚类散点图。每个聚类中心放一个圆角注释胶囊:统一的深石板色边框 (#2C3E50) + 与该簇同色的半透明底色。浅灰点状网格,深色四边框,刻度向内,LaTeX serif 标题(带换行)。
@paper · 来自论文
MemGen: Weaving Generative Latent Memory for Self-Evolving Agents
MemGen:为自进化智能体编织生成式潜在记忆
Guibin Zhang, Muxin Fu, Shuicheng Yan · ICLR 2026
// original from paper · 论文原图
// reproduced via scatter_tsne.py · 脚本复现download png
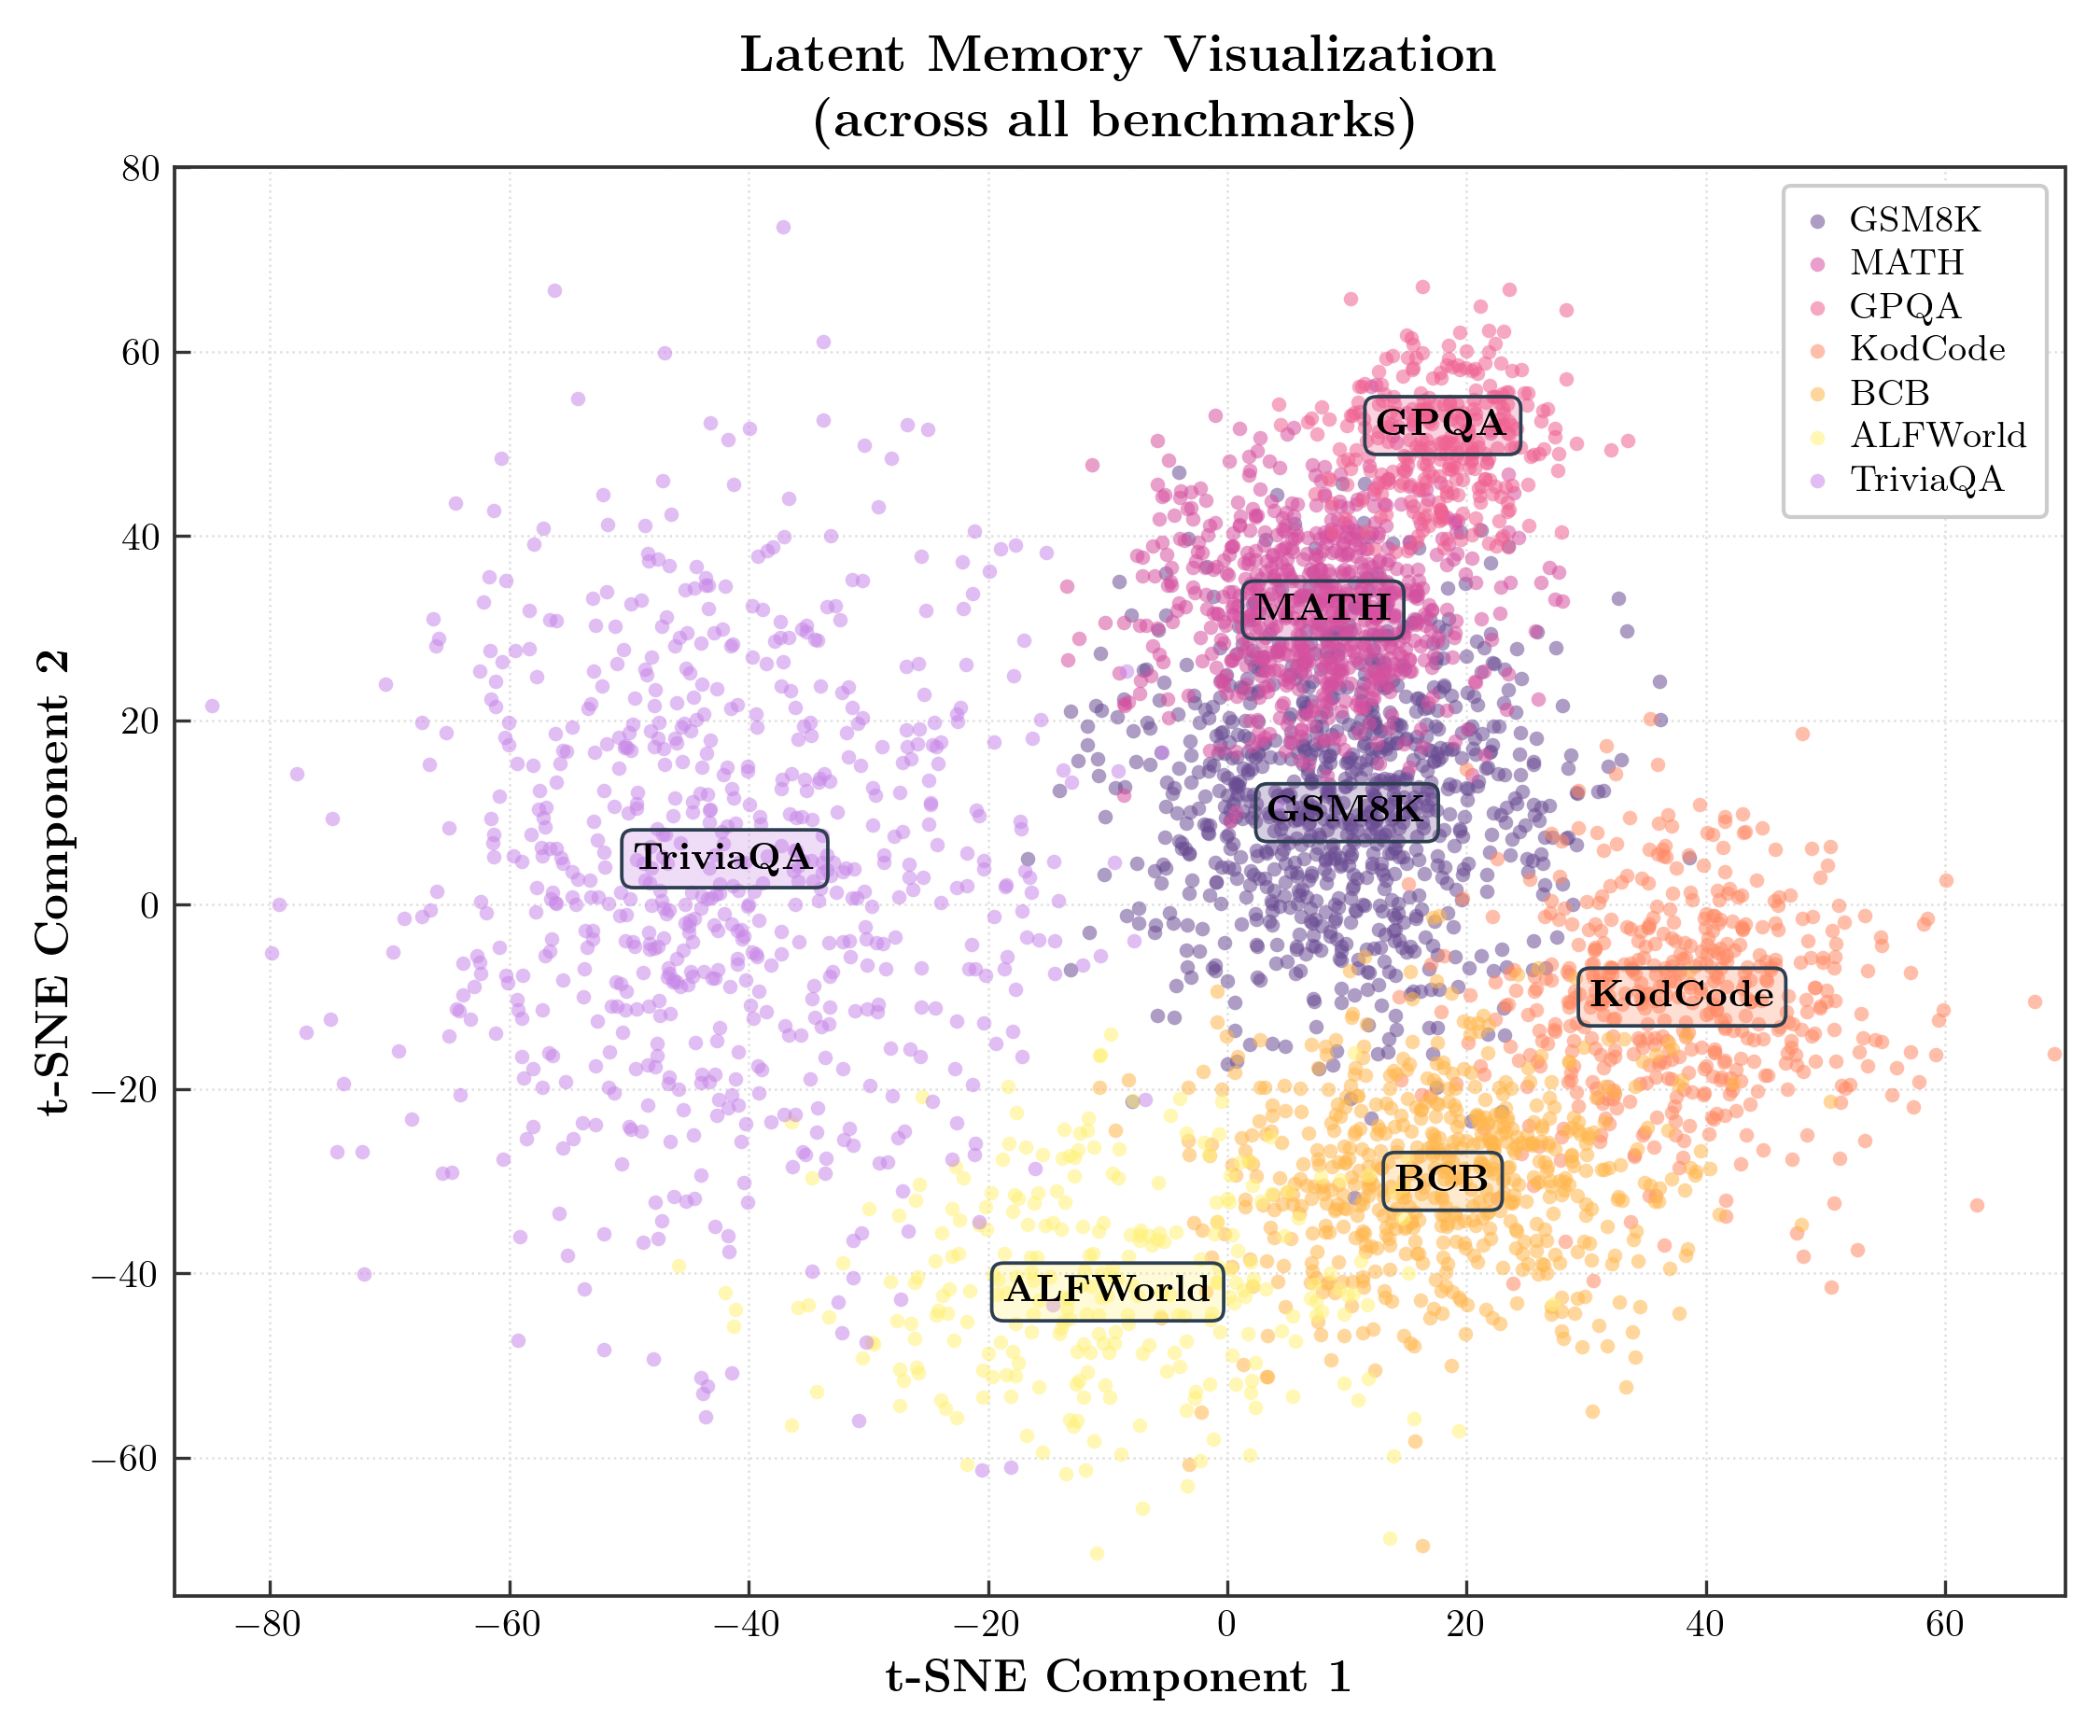
scatter_tsne.py
"""
Reproduce: image7.png — t-SNE Latent Memory Visualization
Style: serif (Computer Modern via usetex), light gray grid,
       4-spine box, annotation boxes with cluster color edges.
"""

import numpy as np
import matplotlib.pyplot as plt
import matplotlib.patches as mpatches

plt.rcParams.update({
    'text.usetex': True,
    'font.family': 'serif',
    'font.serif': ['Computer Modern Roman', 'STIX Two Text', 'DejaVu Serif'],
    'axes.unicode_minus': False,
})

rng = np.random.default_rng(42)

def cluster(cx, cy, n, rx=8, ry=8, shape='round'):
    """生成一个椭圆形聚类,shape='round'|'elongated'"""
    if shape == 'elongated':
        angles = rng.uniform(0, 2 * np.pi, n)
        r = rng.rayleigh(1.0, n)
        x = cx + rx * r * np.cos(angles)
        y = cy + ry * r * np.sin(angles)
    else:
        x = rng.normal(cx, rx, n)
        y = rng.normal(cy, ry, n)
    return x, y


# ---- 数据集颜色(严格参照原图) ----
DS = {
    'GSM8K':    {'color': '#6A4C93', 'n': 900,  'cx':  10, 'cy':  12, 'rx': 9,  'ry': 12},
    'MATH':     {'color': '#D651A0', 'n': 700,  'cx':  8,  'cy':  32, 'rx': 7,  'ry': 8},
    'GPQA':     {'color': '#F06292', 'n': 300,  'cx':  18, 'cy':  50, 'rx': 5,  'ry': 6},
    'KodCode':  {'color': '#FF8A65', 'n': 500,  'cx':  38, 'cy': -10, 'rx': 9,  'ry': 10},
    'BCB':      {'color': '#FFB74D', 'n': 600,  'cx':  18, 'cy': -30, 'rx': 10, 'ry': 9},
    'ALFWorld': {'color': '#FFF176', 'n': 280,  'cx': -10, 'cy': -42, 'rx': 12, 'ry': 10},  # 黄色!
    'TriviaQA': {'color': '#C888E8', 'n': 700,  'cx': -42, 'cy':   5, 'rx': 14, 'ry': 22},
}

# ---- 注释框配置(统一深灰边框,与原图一致;GPQA 也添加)----
ANNOTS = [
    {'name': 'MATH',     'xy': (8,  32),  'xytext': (8,  32)},
    {'name': 'GSM8K',    'xy': (10, 10),  'xytext': (10, 10)},
    {'name': 'GPQA',     'xy': (18, 52),  'xytext': (18, 52)},
    {'name': 'KodCode',  'xy': (38,-10),  'xytext': (38,-10)},
    {'name': 'BCB',      'xy': (18,-30),  'xytext': (18,-30)},
    {'name': 'ALFWorld', 'xy': (-10,-42), 'xytext': (-10,-42)},
    {'name': 'TriviaQA', 'xy': (-42,  5), 'xytext': (-42,  5)},
]
BBOX_EDGECOLOR = '#2C3E50'   # 统一深蓝灰

fig, ax = plt.subplots(figsize=(7.5, 6.2))

for name, cfg in DS.items():
    x, y = cluster(cfg['cx'], cfg['cy'], cfg['n'], cfg['rx'], cfg['ry'])
    ax.scatter(x, y, c=cfg['color'], s=14, alpha=0.55,
               linewidths=0, rasterized=True, label=name, zorder=2)

# ---- 注释框 ----
for ann in ANNOTS:
    color = DS[ann['name']]['color']
    # 注释框:与簇色同色相的浅色半透明底(原图风格)
    import matplotlib.colors as mcolors
    rgba = list(mcolors.to_rgba(color))
    rgba[3] = 0.28   # alpha for facecolor
    ax.annotate(
        r'\textbf{' + ann['name'] + r'}',
        xy=ann['xy'], xytext=ann['xytext'],
        fontsize=10.0,
        bbox=dict(
            boxstyle='round,pad=0.30',
            facecolor=tuple(rgba),
            edgecolor=BBOX_EDGECOLOR,
            linewidth=0.9,
        ),
        ha='center', va='center', zorder=5,
    )

# ---- Axes 样式 ----
ax.set_xlabel(r'\textbf{t-SNE Component 1}', fontsize=12)
ax.set_ylabel(r'\textbf{t-SNE Component 2}', fontsize=12)
ax.set_title(
    r'\textbf{Latent Memory Visualization}' + '\n'
    r'\textbf{(across all benchmarks)}',
    fontsize=13.5, pad=8, linespacing=1.4,
)

ax.set_xlim(-88, 70)
ax.set_ylim(-75, 80)
ax.xaxis.set_major_locator(plt.MultipleLocator(20))
ax.yaxis.set_major_locator(plt.MultipleLocator(20))

# 四边框,深灰接近原图
for sp in ax.spines.values():
    sp.set_visible(True)
    sp.set_linewidth(0.9)
    sp.set_color('#333333')

ax.tick_params(direction='in', length=4, width=0.8, labelsize=10,
               color='#333333')

# 浅灰点线网格(原图风格)
ax.grid(True, color='#E0E0E0', linewidth=0.6, linestyle=':', zorder=0)
ax.set_axisbelow(True)

# ---- 图例(原图有白底浅灰框) ----
leg = ax.legend(
    loc='upper right',
    fontsize=9.5,
    frameon=True,
    facecolor='white',
    edgecolor='#CCCCCC',
    framealpha=1.0,
    markerscale=1.0,
    handlelength=0.8,
    handleheight=0.8,
    handletextpad=0.5,
    labelspacing=0.25,
    borderpad=0.5,
    borderaxespad=0.5,
)

fig.tight_layout(pad=0.9)
fig.savefig(
    'scatter_tsne_repro.png',
    dpi=300, facecolor='white',
)
plt.close(fig)
print('saved: scatter_tsne_repro.png')