AI-Scientist · Model × environment-scope heatmap with marginal bars
AI-Scientist · 模型×环境-子任务热度图 + 边缘条形图
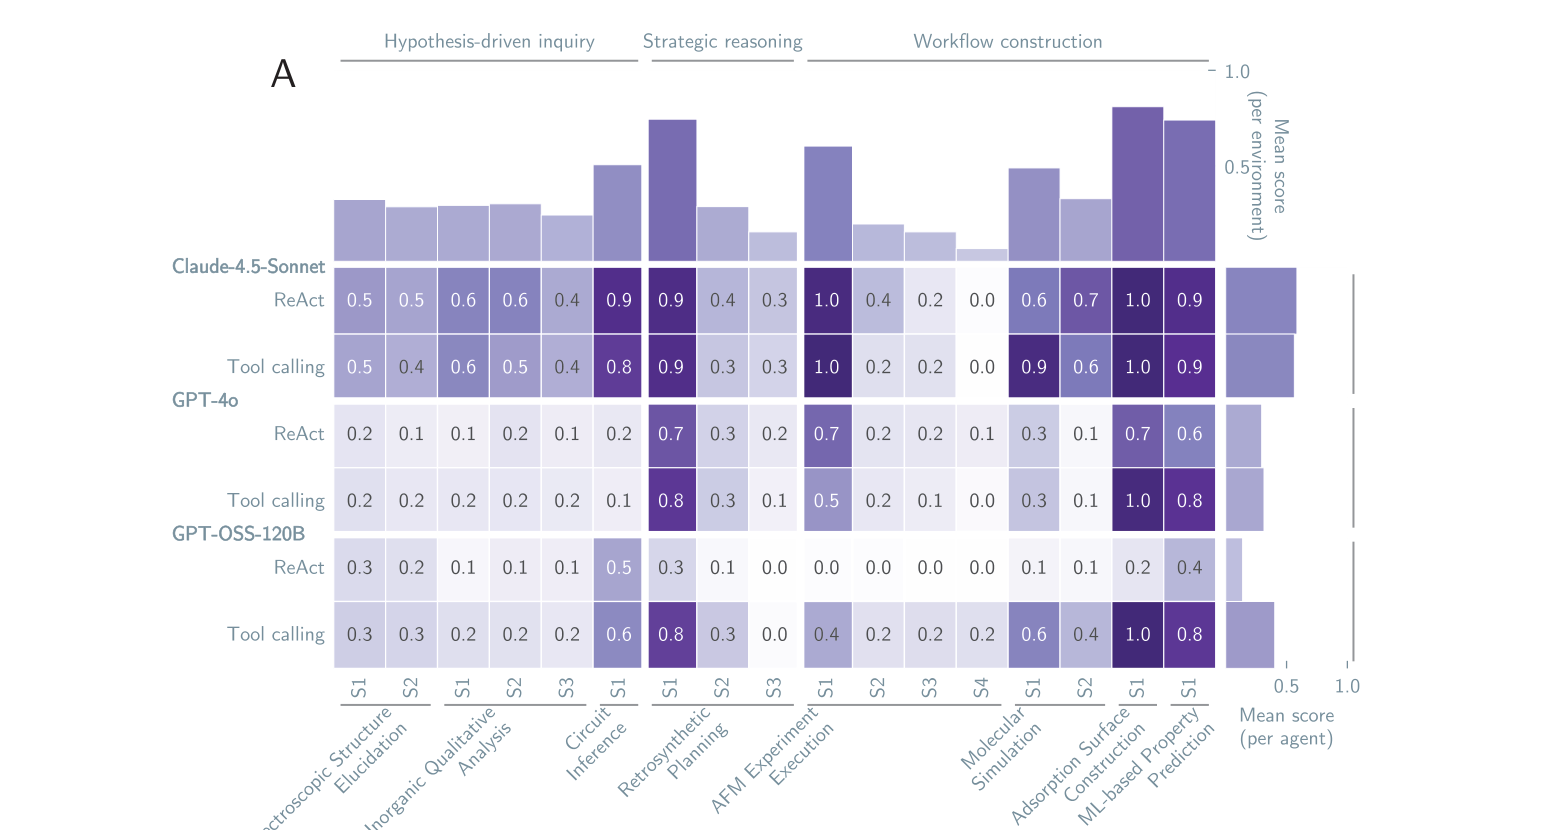
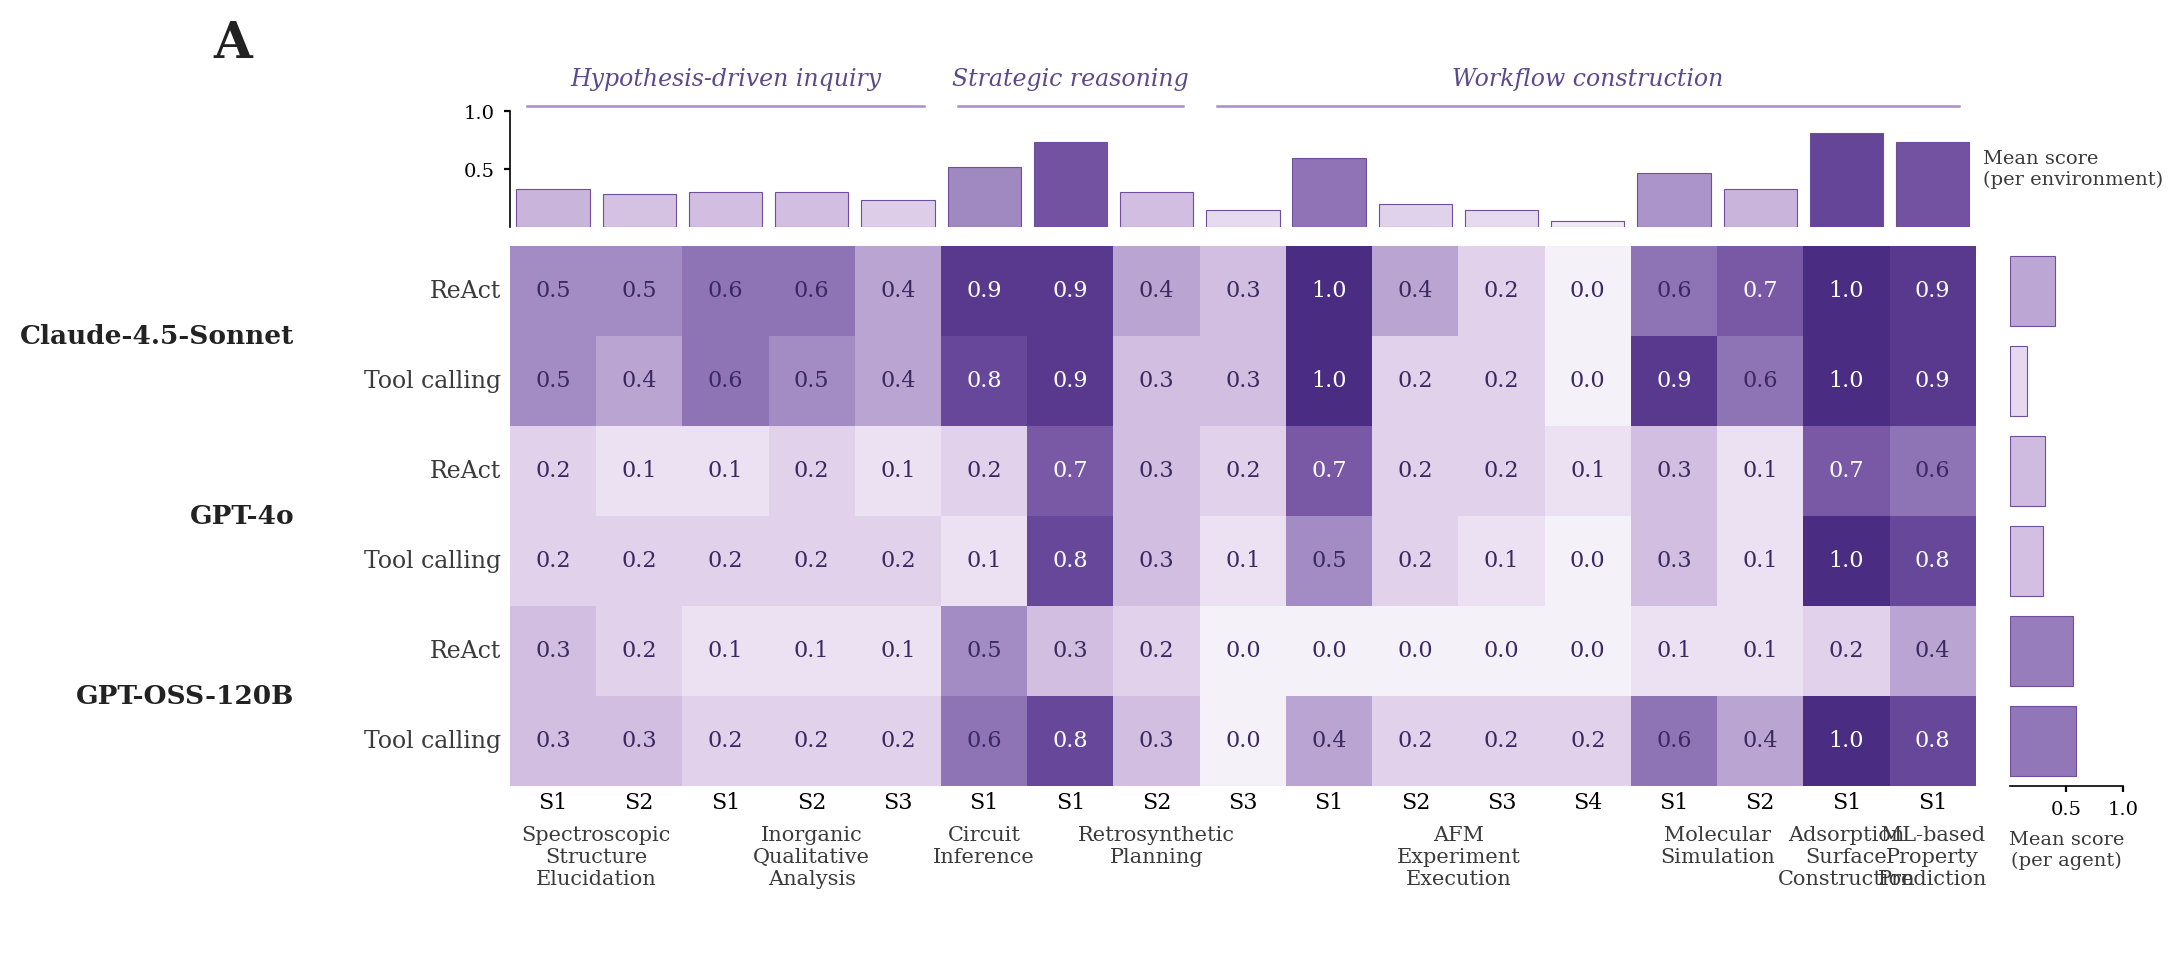
Reproduction of arXiv:2604.18805 Figure 2A. A 6 × 16 purple heatmap of average pass scores across three frontier models (Claude-4.5-Sonnet / GPT-4o / GPT-OSS-120B) under two scaffolds (ReAct / Tool calling). The rows decompose into eight environments (× 1–4 task-scope columns each) and three top-level groups (Hypothesis-driven inquiry / Strategic reasoning / Workflow construction). Two marginal bar charts hang off the heatmap: column means on top, row means on the right.
arXiv:2604.18805 Figure 2A 复现。6 × 16 紫色梯度热度图:三大前沿模型(Claude-4.5-Sonnet / GPT-4o / GPT-OSS-120B)× 两种 scaffold(ReAct / Tool calling);列方向是 8 个环境(每个 1-4 个 task-scope 子列)并归为 Hypothesis-driven inquiry / Strategic reasoning / Workflow construction 三大组。热度图上方是按环境的平均得分柱图,右侧是按 agent 的平均得分柱图。
@paper · 来自论文
Behavioral Analysis of LLM-based AI Scientists across Scientific Domains
LLM 科学智能体的跨学科行为分析
AI Scientist Behavioral Analysis Authors · arXiv 2026
"""Reproduction of AI-Scientist Figure 2A (model x environment heatmap).

Anonymised reproduction of arXiv:2604.18805 Figure 2A:
6 rows (3 models x 2 scaffolds) by 16 environment-scope columns; each cell
holds an average performance score in [0, 1] coloured on the `Purples`
ramp. Two marginal bar charts hang off the heatmap:
  * top:    Mean score per environment (axis 0)
  * right:  Mean score per agent       (axis 1)

All numbers are inline so the script is fully self-contained.
"""

import numpy as np
import matplotlib.pyplot as plt
from matplotlib.colors import LinearSegmentedColormap
ROW_MODELS = ["Claude-4.5-Sonnet", "GPT-4o", "GPT-OSS-120B"]
ROW_SCAFFOLDS = ["ReAct", "Tool calling"]
ROWS = [f"{m} | {s}" for m in ROW_MODELS for s in ROW_SCAFFOLDS]

ENVS = [
    ("Spectroscopic\nStructure\nElucidation", ["S1", "S2"]),
    ("Inorganic\nQualitative\nAnalysis",       ["S1", "S2", "S3"]),
    ("Circuit\nInference",                       ["S1"]),
    ("Retrosynthetic\nPlanning",                 ["S1", "S2", "S3"]),
    ("AFM\nExperiment\nExecution",               ["S1", "S2", "S3", "S4"]),
    ("Molecular\nSimulation",                    ["S1", "S2"]),
    ("Adsorption\nSurface\nConstruction",        ["S1"]),
    ("ML-based\nProperty\nPrediction",           ["S1"]),
]
ENV_GROUPS = [
    ("Hypothesis-driven inquiry", 0, 5),
    ("Strategic reasoning",       5, 8),
    ("Workflow construction",     8, 17),
]
COL_LABELS = [s for _, scopes in ENVS for s in scopes]
N_COLS = len(COL_LABELS)

DATA = np.array([
    [0.5, 0.5, 0.6, 0.6, 0.4, 0.9, 0.9, 0.4, 0.3, 1.0, 0.4, 0.2, 0.0, 0.6, 0.7, 1.0, 0.9],
    [0.5, 0.4, 0.6, 0.5, 0.4, 0.8, 0.9, 0.3, 0.3, 1.0, 0.2, 0.2, 0.0, 0.9, 0.6, 1.0, 0.9],
    [0.2, 0.1, 0.1, 0.2, 0.1, 0.2, 0.7, 0.3, 0.2, 0.7, 0.2, 0.2, 0.1, 0.3, 0.1, 0.7, 0.6],
    [0.2, 0.2, 0.2, 0.2, 0.2, 0.1, 0.8, 0.3, 0.1, 0.5, 0.2, 0.1, 0.0, 0.3, 0.1, 1.0, 0.8],
    [0.3, 0.2, 0.1, 0.1, 0.1, 0.5, 0.3, 0.2, 0.0, 0.0, 0.0, 0.0, 0.0, 0.1, 0.1, 0.2, 0.4],
    [0.3, 0.3, 0.2, 0.2, 0.2, 0.6, 0.8, 0.3, 0.0, 0.4, 0.2, 0.2, 0.2, 0.6, 0.4, 1.0, 0.8],
])
assert DATA.shape == (6, N_COLS)

PURPLES = LinearSegmentedColormap.from_list(
    "soft_purples",
    ["#f5f1f9", "#dccae8", "#a48cc4", "#6f4ea0", "#4a2d83"],
)

plt.rcParams.update({
    "font.family": "serif",
    "font.size": 9,
    "axes.spines.right": False,
    "axes.spines.top": False,
    "axes.linewidth": 0.6,
})

fig = plt.figure(figsize=(11.5, 5.4))
gs = fig.add_gridspec(
    3, 3,
    width_ratios=[2.4, 26, 2.0],
    height_ratios=[3.0, 14.0, 3.6],
    wspace=0.06,
    hspace=0.07,
)

ax_top = fig.add_subplot(gs[0, 1])
ax_main = fig.add_subplot(gs[1, 1])
ax_right = fig.add_subplot(gs[1, 2])
ax_yLabel = fig.add_subplot(gs[1, 0]); ax_yLabel.axis("off")
ax_xLabel = fig.add_subplot(gs[2, 1]); ax_xLabel.axis("off")

ax_main.imshow(DATA, cmap=PURPLES, vmin=0.0, vmax=1.0, aspect="auto")
for i in range(DATA.shape[0]):
    for j in range(DATA.shape[1]):
        v = DATA[i, j]
        col = "white" if v >= 0.7 else "#3a2860"
        ax_main.text(j, i, f"{v:.1f}", ha="center", va="center",
                     fontsize=8.0, color=col)

for s in ["top", "right", "left", "bottom"]:
    ax_main.spines[s].set_visible(False)
ax_main.set_xticks(range(N_COLS))
ax_main.set_xticklabels(COL_LABELS, fontsize=8.0)
ax_main.set_yticks([])
ax_main.tick_params(axis="x", which="both", length=0, pad=2)
ax_main.tick_params(axis="y", which="both", length=0)

env_means = DATA.mean(axis=0)
ax_top.bar(range(N_COLS), env_means, color=PURPLES(env_means), width=0.85,
           edgecolor="#6f4ea0", linewidth=0.4)
ax_top.set_xlim(ax_main.get_xlim())
ax_top.set_xticks([])
ax_top.set_ylim(0, 1.0)
ax_top.set_yticks([0.5, 1.0])
ax_top.tick_params(axis="y", labelsize=7, length=2)
ax_top.text(1.005, 0.5, "Mean score\n(per environment)",
            transform=ax_top.transAxes, fontsize=7, va="center", ha="left",
            color="#3a3a3a", rotation=0)
for s in ["top", "right"]:
    ax_top.spines[s].set_visible(False)
ax_top.spines["left"].set_linewidth(0.6)
ax_top.spines["bottom"].set_visible(False)

agent_means = DATA.mean(axis=1)
ax_right.barh(range(DATA.shape[0])[::-1], agent_means,
              color=PURPLES(agent_means), edgecolor="#6f4ea0", linewidth=0.4,
              height=0.78)
ax_right.set_ylim(ax_main.get_ylim())
ax_right.set_yticks([])
ax_right.set_xlim(0, 1.0)
ax_right.set_xticks([0.5, 1.0])
ax_right.tick_params(axis="x", labelsize=7, length=2)
ax_right.set_xlabel("Mean score\n(per agent)", fontsize=7, color="#3a3a3a")
for s in ["top", "right"]:
    ax_right.spines[s].set_visible(False)
ax_right.spines["bottom"].set_linewidth(0.6)
ax_right.spines["left"].set_visible(False)

for i, (model, scaffold) in enumerate(
    [(m, s) for m in ROW_MODELS for s in ROW_SCAFFOLDS]
):
    ax_main.text(-0.6, i, scaffold, ha="right", va="center", fontsize=8.5,
                 color="#3a3a3a")
    if i % 2 == 0:
        ax_main.text(-3.0, i + 0.5, model, ha="right", va="center",
                     fontsize=9.5, fontweight="bold", color="#222")

ENV_X_RANGES = []
cursor = 0
for env_text, scopes in ENVS:
    ENV_X_RANGES.append((env_text, cursor, cursor + len(scopes) - 1))
    cursor += len(scopes)
for env_text, x0, x1 in ENV_X_RANGES:
    cx = (x0 + x1) / 2
    ax_xLabel.text(cx, 0.85, env_text, ha="center", va="top", fontsize=7.5,
                   color="#3a3a3a")
ax_xLabel.set_xlim(ax_main.get_xlim())
ax_xLabel.set_ylim(0, 1)
ax_xLabel.axis("off")

for grp_name, gx0, gx1 in ENV_GROUPS:
    cx = (gx0 + gx1 - 1) / 2
    ax_top.plot([gx0 - 0.3, gx1 - 0.7], [1.05, 1.05],
                transform=ax_top.get_xaxis_transform(),
                color="#a98fc6", linewidth=0.9, clip_on=False)
    ax_top.text(cx, 1.18, grp_name, ha="center", va="bottom", fontsize=8.5,
                style="italic", color="#5a4a8b",
                transform=ax_top.get_xaxis_transform())

fig.text(0.07, 0.93, "A", fontsize=18, fontweight="bold", color="#222")

plt.savefig("aiscientist_heatmap_repro.png", dpi=200, bbox_inches="tight")
print("saved aiscientist_heatmap_repro.png")