Bar Chart · 柱状图#hatch-fill#multiplier-annotation#per-panel-color#times-new-roman
PreRL · 1×3 hatched bar panels with multiplier annotations
PreRL · 1×3 斜线/网格 hatch 柱图 + 倍率标注
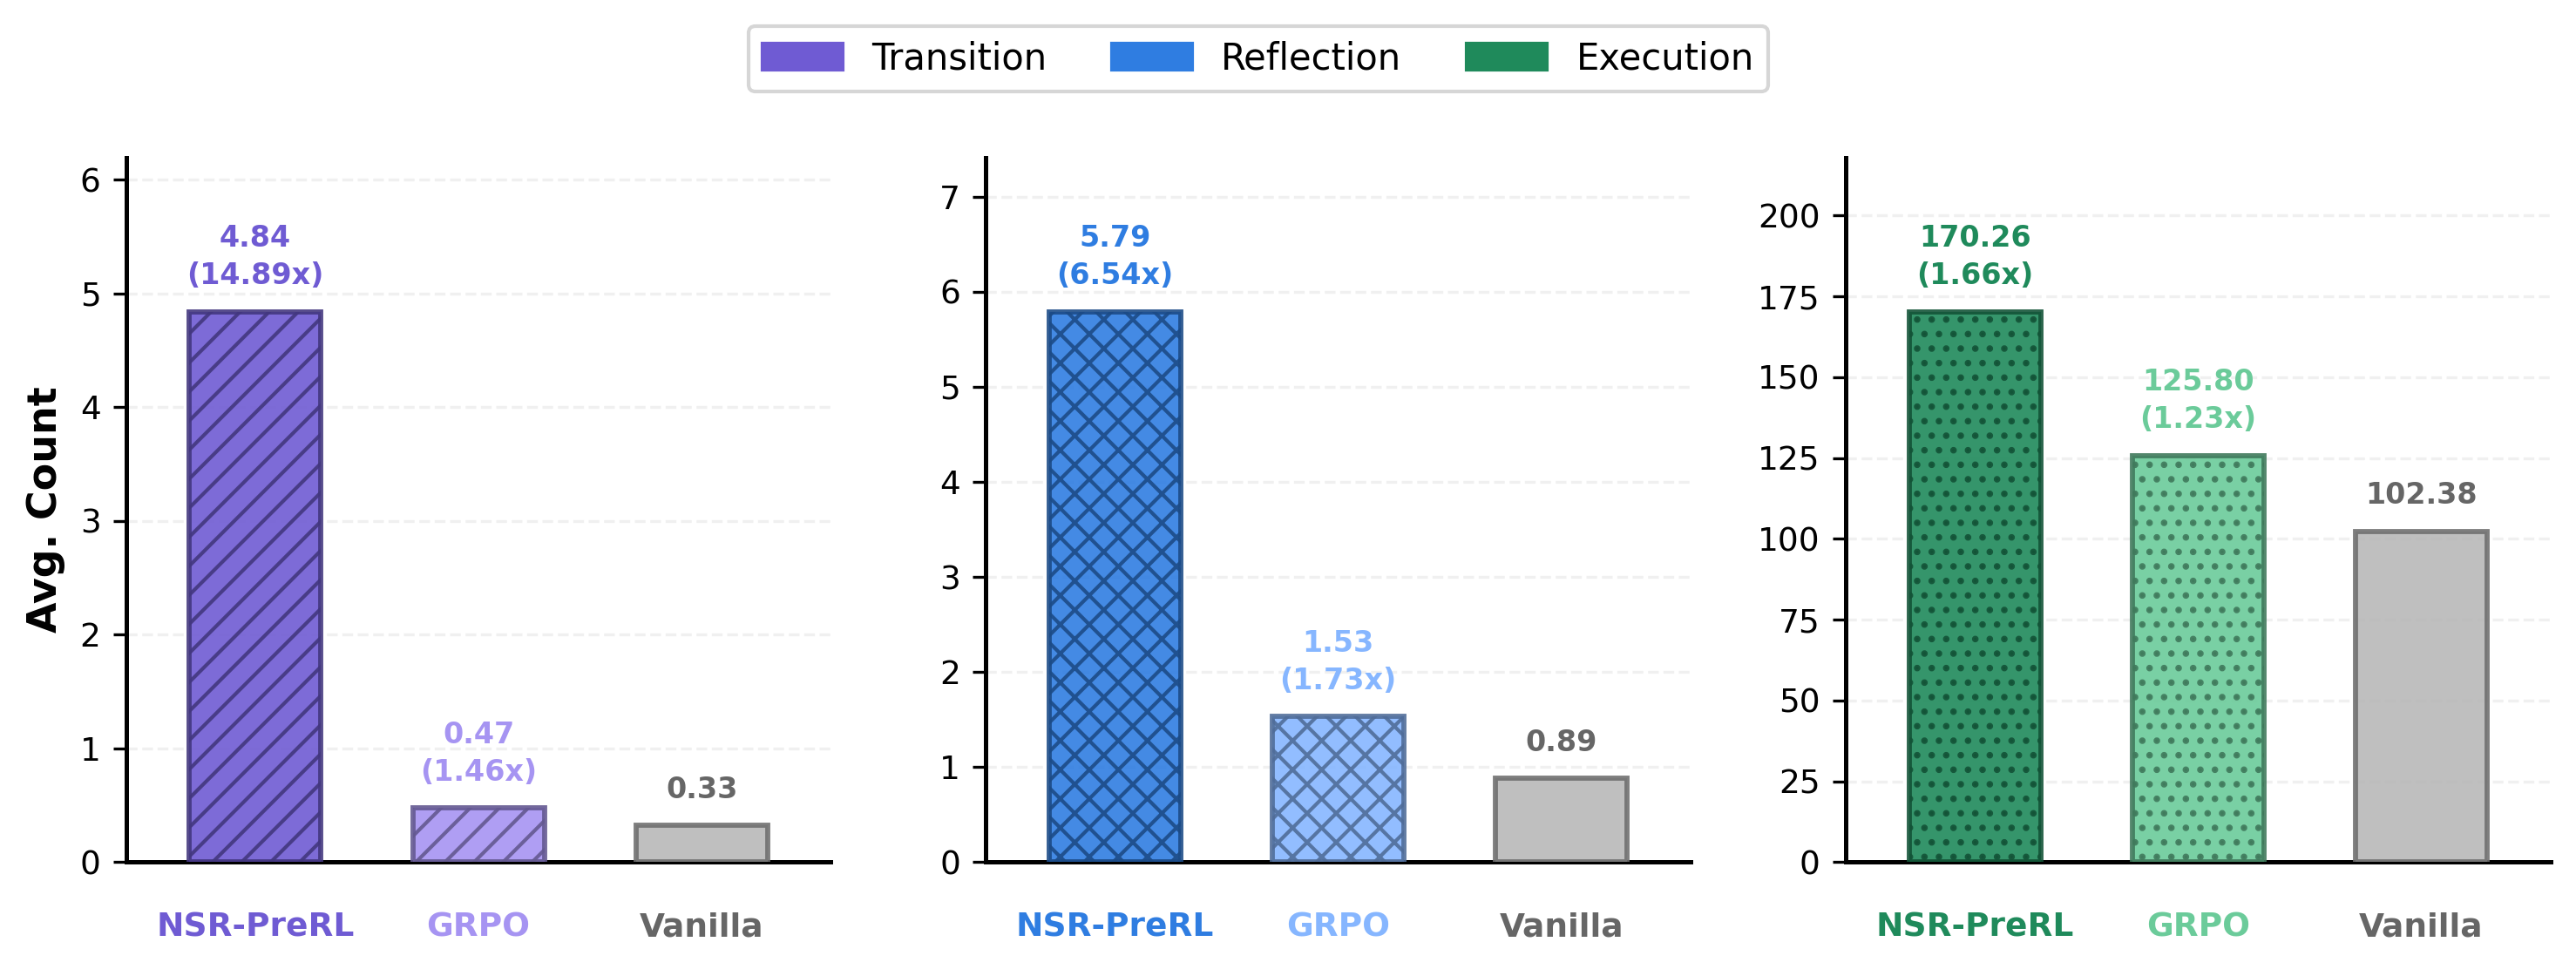
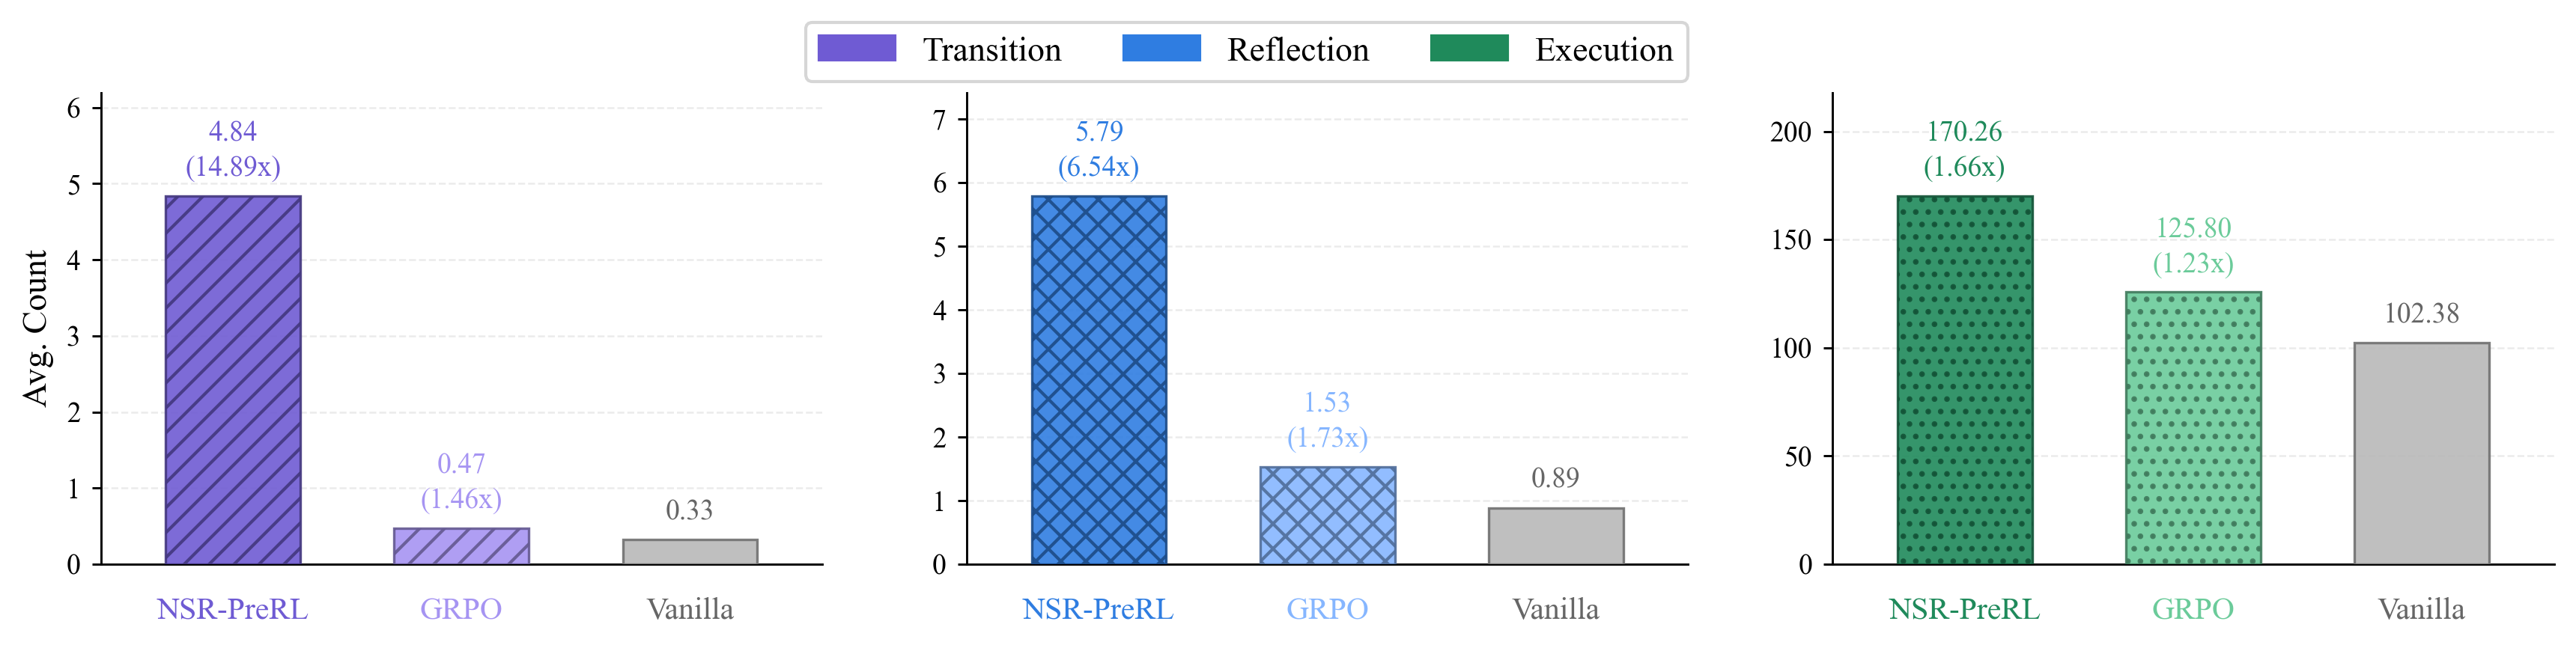
1×3 grouped bar panels (Transition / Reflection / Execution), each with its own y-scale and colour family (purple / blue / green). Two non-Vanilla bars per panel use diagonal (///) or cross (xxx) or dotted (...) hatching, with bold-coloured bar-top labels showing absolute count and the relative multiplier vs Vanilla (e.g. `4.84 (14.89x)`). Method names sit below the x-axis, colour-coded; top-centre legend with hatched patches.
1×3 分组柱状面板(Transition / Reflection / Execution),每面板独立 y 轴和独立色系(紫 / 蓝 / 绿)。两个非 Vanilla 柱用 /// 斜线、xxx 网格、... 点状 hatch 区分,柱顶用同色标注绝对值与相对 Vanilla 的倍数(如 `4.84 (14.89x)`)。方法名写在 x 轴下方并按色系着色,顶部居中带 hatch 图例。
@paper · 来自论文
PreRL: Pre-train-Anchored Reinforcement Learning for Language Models
PreRL:预训练锚定的语言模型强化学习
PreRL Authors · arXiv 2026
// original from paper · 论文原图
// reproduced via prerl_behavior_bars.py · 脚本复现download png
prerl_behavior_bars.py
"""1x3 hatched bar panels: cognitive-behavior counts (NSR-PreRL vs GRPO vs Vanilla).

Reproduces the `behavior_count_clean` figure from the PreRL paper
(arXiv:2602.02488). Each panel uses its own colour family (purple /
blue / green) and its own y-scale, with diagonal / cross / dotted hatches
distinguishing the proposed method and GRPO from the Vanilla baseline.
Each non-Vanilla bar is annotated with both its absolute value and the
relative multiplier vs Vanilla.

Standalone: just `python prerl_behavior_bars.py`. No external data.
"""

import numpy as np
import matplotlib.pyplot as plt
from matplotlib.patches import Patch

# ──────────────────────────────────────────────────────────────────────
# Data
# ──────────────────────────────────────────────────────────────────────
data = {
    "Transition": {"NSR-PreRL": 4.8400,   "GRPO": 0.4750,   "Vanilla": 0.3250},
    "Reflection": {"NSR-PreRL": 5.7900,   "GRPO": 1.5333,   "Vanilla": 0.8850},
    "Execution":  {"NSR-PreRL": 170.2567, "GRPO": 125.8017, "Vanilla": 102.3750},
}

methods = ["NSR-PreRL", "GRPO", "Vanilla"]
behaviors = ["Transition", "Reflection", "Execution"]

palette = {
    "Transition": {"NSR-PreRL": "#6F5BD3", "GRPO": "#A694F2", "Vanilla": "#B8B8B8"},
    "Reflection": {"NSR-PreRL": "#2F7DE1", "GRPO": "#86B6FF", "Vanilla": "#B8B8B8"},
    "Execution":  {"NSR-PreRL": "#1F8A5B", "GRPO": "#6BCB9A", "Vanilla": "#B8B8B8"},
}

hatches = {
    "Transition": {"NSR-PreRL": "///", "GRPO": "///", "Vanilla": ""},
    "Reflection": {"NSR-PreRL": "xxx", "GRPO": "xxx", "Vanilla": ""},
    "Execution":  {"NSR-PreRL": "...", "GRPO": "...", "Vanilla": ""},
}

# ──────────────────────────────────────────────────────────────────────
# Style
# ──────────────────────────────────────────────────────────────────────
plt.rcParams.update({
    "font.family":       "serif",
    "font.serif":        ["Times New Roman", "Times", "DejaVu Serif"],
    "axes.spines.top":   False,
    "axes.spines.right": False,
    "axes.linewidth":    0.7,
    "xtick.major.size":  0,
    "ytick.major.size":  3,
    "ytick.major.width": 0.7,
    "ytick.labelsize":   9,
})

BAR_W = 0.56
X     = np.array([0.00, 0.95, 1.90])
XLIM  = (-0.55, 2.45)


def format_ax(ax):
    ax.set_xlim(*XLIM)
    ax.set_xticks([])
    ax.grid(axis="y", linestyle="--", linewidth=0.6, alpha=0.25, zorder=0)
    for side in ("left", "bottom"):
        ax.spines[side].set_linewidth(0.7)


def draw_bars(ax, behavior, vals):
    colors = palette[behavior]
    pats   = hatches[behavior]
    y0, y1 = ax.get_ylim()
    yr     = y1 - y0
    v_van  = vals[2]
    for x, m, v in zip(X, methods, vals):
        c = colors[m]
        edge = (
            tuple(max(0, ch * 0.6) for ch in plt.matplotlib.colors.to_rgb(c))
            if m != "Vanilla" else "#707070"
        )
        ax.bar(x, v, width=BAR_W, color=c, edgecolor=edge,
               linewidth=0.8, hatch=pats[m], alpha=0.90, zorder=3)

        if y0 <= v <= y1:
            txt_color = c if m != "Vanilla" else "#666666"
            if m != "Vanilla":
                ratio = v / v_van
                label = f"{v:.2f}\n({ratio:.2f}x)"
                ax.text(x, v + 0.03 * yr, label,
                        ha="center", va="bottom", fontsize=9,
                        color=txt_color, zorder=5, linespacing=1.4)
            else:
                ax.text(x, v + 0.03 * yr, f"{v:.2f}",
                        ha="center", va="bottom", fontsize=9,
                        color=txt_color, zorder=5)


def draw_method_labels(ax, behavior):
    colors = palette[behavior]
    y0, y1 = ax.get_ylim()
    yr     = y1 - y0
    for x, m in zip(X, methods):
        c = colors[m] if m != "Vanilla" else "#666666"
        ax.text(x, y0 - 0.07 * yr, m,
                ha="center", va="top", fontsize=10,
                color=c, clip_on=False)


# ──────────────────────────────────────────────────────────────────────
# Figure (1×3, hatched bars)
# ──────────────────────────────────────────────────────────────────────
fig   = plt.figure(figsize=(12, 3), facecolor="white")
outer = fig.add_gridspec(1, 3, left=0.075, right=0.985,
                         bottom=0.18, top=0.88, wspace=0.2)

legend_handles = [
    Patch(facecolor=palette["Transition"]["NSR-PreRL"],
          edgecolor=palette["Transition"]["NSR-PreRL"], hatch="///", label="Transition"),
    Patch(facecolor=palette["Reflection"]["NSR-PreRL"],
          edgecolor=palette["Reflection"]["NSR-PreRL"], hatch="xxx", label="Reflection"),
    Patch(facecolor=palette["Execution"]["NSR-PreRL"],
          edgecolor=palette["Execution"]["NSR-PreRL"], hatch="...", label="Execution"),
]

for i, behavior in enumerate(behaviors):
    vals = [data[behavior][m] for m in methods]

    sub = outer[0, i].subgridspec(1, 1)
    ax  = fig.add_subplot(sub[0, 0])

    y_max = max(vals) * 1.28
    ax.set_ylim(0, y_max)
    format_ax(ax)
    draw_bars(ax, behavior, vals)
    draw_method_labels(ax, behavior)

    ax.spines["top"].set_visible(False)
    ax.spines["right"].set_visible(False)

    if i == 0:
        ax.set_ylabel("Avg. Count", fontsize=11)

fig.legend(handles=legend_handles, ncol=3, loc="upper center",
           bbox_to_anchor=(0.5, 1.01), fontsize=11, frameon=True,
           fancybox=True, columnspacing=1.8, handlelength=2.2)

plt.savefig("behavior_count_clean.png",
            dpi=300, bbox_inches="tight", facecolor="white")
print("Saved behavior_count_clean.png")