Table · 表格#table#heat-cell#plot-from-image#wide-aspect
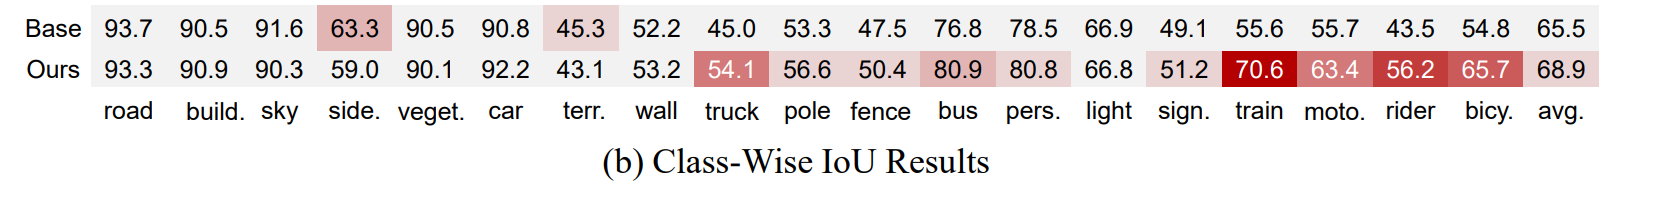
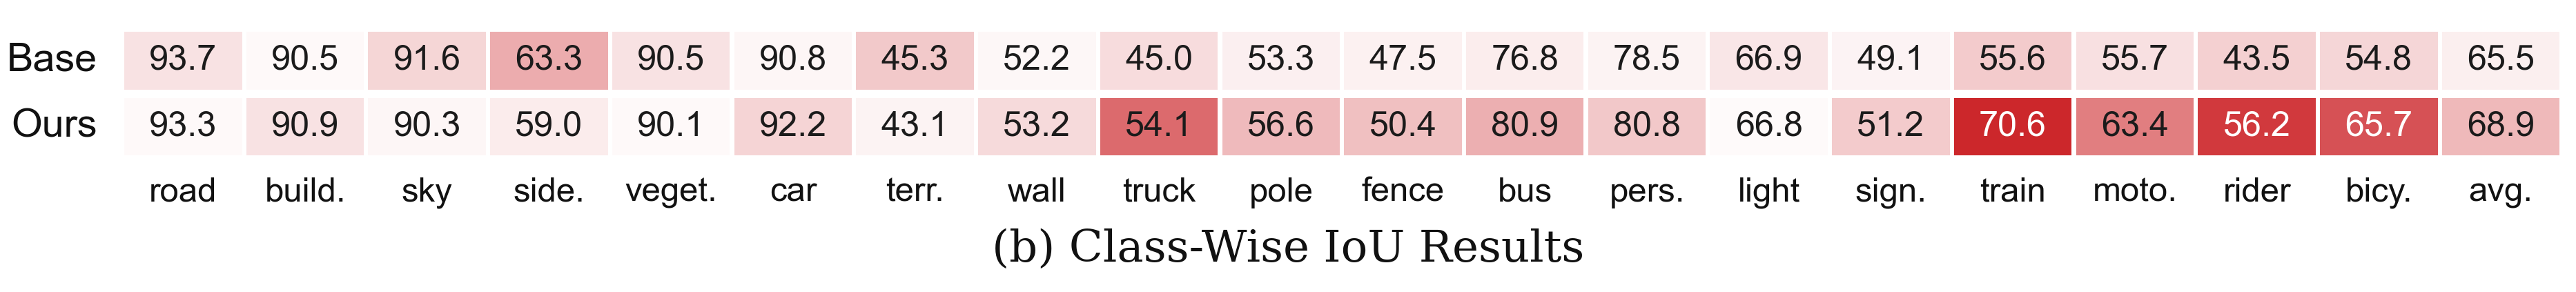
Class-wise IoU · 2-row heat-shaded comparison table
Class-wise IoU · 双行热度色块对比表
Long flat table (AR≈8:1) comparing Base vs Ours across 19 semantic-segmentation classes plus average. Each cell is a rectangle whose red intensity scales with the row's win margin against the other; winner cells with the largest gap flip to white text. Demonstrates the `plot-from-image` skill: an arbitrary paper figure rebuilt with raw matplotlib Rectangles + ax.text — no plt.table involved.
AR≈8:1 的长扁表格,对比 Base 与 Ours 在 19 个语义分割类别 + 平均上的 IoU。每个单元格是一个矩形:红色饱和度按该行相对另一行的胜出幅度递增,且大幅胜出格子的字体翻成白色。这一条目示范的是 `plot-from-image` 技能——用裸 matplotlib Rectangle + ax.text 直接搭表,而不是 plt.table。
@paper · 来自论文
Plot-from-image · Class-wise IoU demo (community paper figure)
plot-from-image · Class-wise IoU 演示(用户上传论文截图)
paper_experiment_plot_skills contributors · community 2025
// original from paper · 论文原图
// reproduced via classwise_iou.py · 脚本复现download png
classwise_iou.py
"""
Reproduce: Class-Wise IoU Results
Original: 1671x209 px  AR=8.00
"""

from __future__ import annotations

import matplotlib.pyplot as plt
import numpy as np
from matplotlib.patches import Rectangle


LABELS = [
    "road",
    "build.",
    "sky",
    "side.",
    "veget.",
    "car",
    "terr.",
    "wall",
    "truck",
    "pole",
    "fence",
    "bus",
    "pers.",
    "light",
    "sign.",
    "train",
    "moto.",
    "rider",
    "bicy.",
    "avg.",
]

BASE = np.array(
    [
        93.7,
        90.5,
        91.6,
        63.3,
        90.5,
        90.8,
        45.3,
        52.2,
        45.0,
        53.3,
        47.5,
        76.8,
        78.5,
        66.9,
        49.1,
        55.6,
        55.7,
        43.5,
        54.8,
        65.5,
    ]
)

OURS = np.array(
    [
        93.3,
        90.9,
        90.3,
        59.0,
        90.1,
        92.2,
        43.1,
        53.2,
        54.1,
        56.6,
        50.4,
        80.9,
        80.8,
        66.8,
        51.2,
        70.6,
        63.4,
        56.2,
        65.7,
        68.9,
    ]
)


def blend(color_a: str, color_b: str, ratio: float) -> tuple[float, float, float]:
    """Blend two hex colors."""
    ratio = float(np.clip(ratio, 0.0, 1.0))
    a = np.array([int(color_a[i : i + 2], 16) for i in (1, 3, 5)], dtype=float)
    b = np.array([int(color_b[i : i + 2], 16) for i in (1, 3, 5)], dtype=float)
    return tuple(((1 - ratio) * a + ratio * b) / 255.0)


def cell_color(delta_strength: float, is_winner: bool) -> tuple[float, float, float]:
    """
    Approximate the paper's heat shading:
    winner row gets stronger red, loser row stays very light.
    """
    if is_winner:
        ratio = 0.10 + 0.82 * delta_strength
    else:
        ratio = 0.02 + 0.20 * delta_strength
    return blend("#ffffff", "#c81419", ratio)


def text_color(delta_strength: float, is_winner: bool) -> str:
    if is_winner and delta_strength >= 0.72:
        return "white"
    return "#1b1b1b"


def draw_row(
    ax: plt.Axes,
    values: np.ndarray,
    other_values: np.ndarray,
    row_label: str,
    y0: float,
    cell_w: float,
    cell_h: float,
    gap: float,
    x0: float,
) -> None:
    deltas = values - other_values
    strengths = np.clip(np.abs(deltas) / 14.0, 0.0, 1.0)

    ax.text(
        x0 - 0.22,
        y0 + cell_h / 2,
        row_label,
        ha="right",
        va="center",
        fontsize=13.8,
        family="sans-serif",
        color="#111111",
    )

    for i, val in enumerate(values):
        is_winner = val >= other_values[i]
        x = x0 + i * (cell_w + gap)
        face = cell_color(strengths[i], is_winner)
        ax.add_patch(
            Rectangle(
                (x, y0),
                cell_w,
                cell_h,
                facecolor=face,
                edgecolor="none",
            )
        )
        ax.text(
            x + cell_w / 2,
            y0 + cell_h / 2,
            f"{val:.1f}",
            ha="center",
            va="center",
            fontsize=12.1,
            family="sans-serif",
            color=text_color(strengths[i], is_winner),
        )


def main() -> None:
    plt.rcParams.update(
        {
            "font.family": "sans-serif",
            "font.sans-serif": ["Arial", "Helvetica", "DejaVu Sans"],
        }
    )

    n_cols = len(LABELS)
    cell_w = 0.96
    cell_h = 0.42
    gap = 0.035
    x0 = 0.98

    total_w = x0 + n_cols * (cell_w + gap) - gap + 0.10
    fig, ax = plt.subplots(figsize=(16.0, 1.78))
    ax.set_xlim(0, total_w)
    ax.set_ylim(-0.58, 1.48)
    ax.axis("off")

    draw_row(ax, BASE, OURS, "Base", y0=0.86, cell_w=cell_w, cell_h=cell_h, gap=gap, x0=x0)
    draw_row(ax, OURS, BASE, "Ours", y0=0.38, cell_w=cell_w, cell_h=cell_h, gap=gap, x0=x0)

    for i, label in enumerate(LABELS):
        x = x0 + i * (cell_w + gap) + cell_w / 2
        ax.text(
            x,
            0.11,
            label,
            ha="center",
            va="center",
            fontsize=11.8,
            family="sans-serif",
            color="#111111",
        )

    ax.text(
        total_w / 2,
        -0.30,
        "(b) Class-Wise IoU Results",
        ha="center",
        va="center",
        fontsize=15.4,
        family="serif",
        color="#111111",
    )

    fig.savefig(
        "classwise_iou_repro.png",
        dpi=300,
        facecolor="white",
        bbox_inches="tight",
        pad_inches=0.02,
    )
    plt.close(fig)


if __name__ == "__main__":
    main()