Paper-Espresso · AI research hype-cycle (Gartner-style) chart
Paper-Espresso · AI 研究 Gartner 风格 Hype-Cycle 曲线
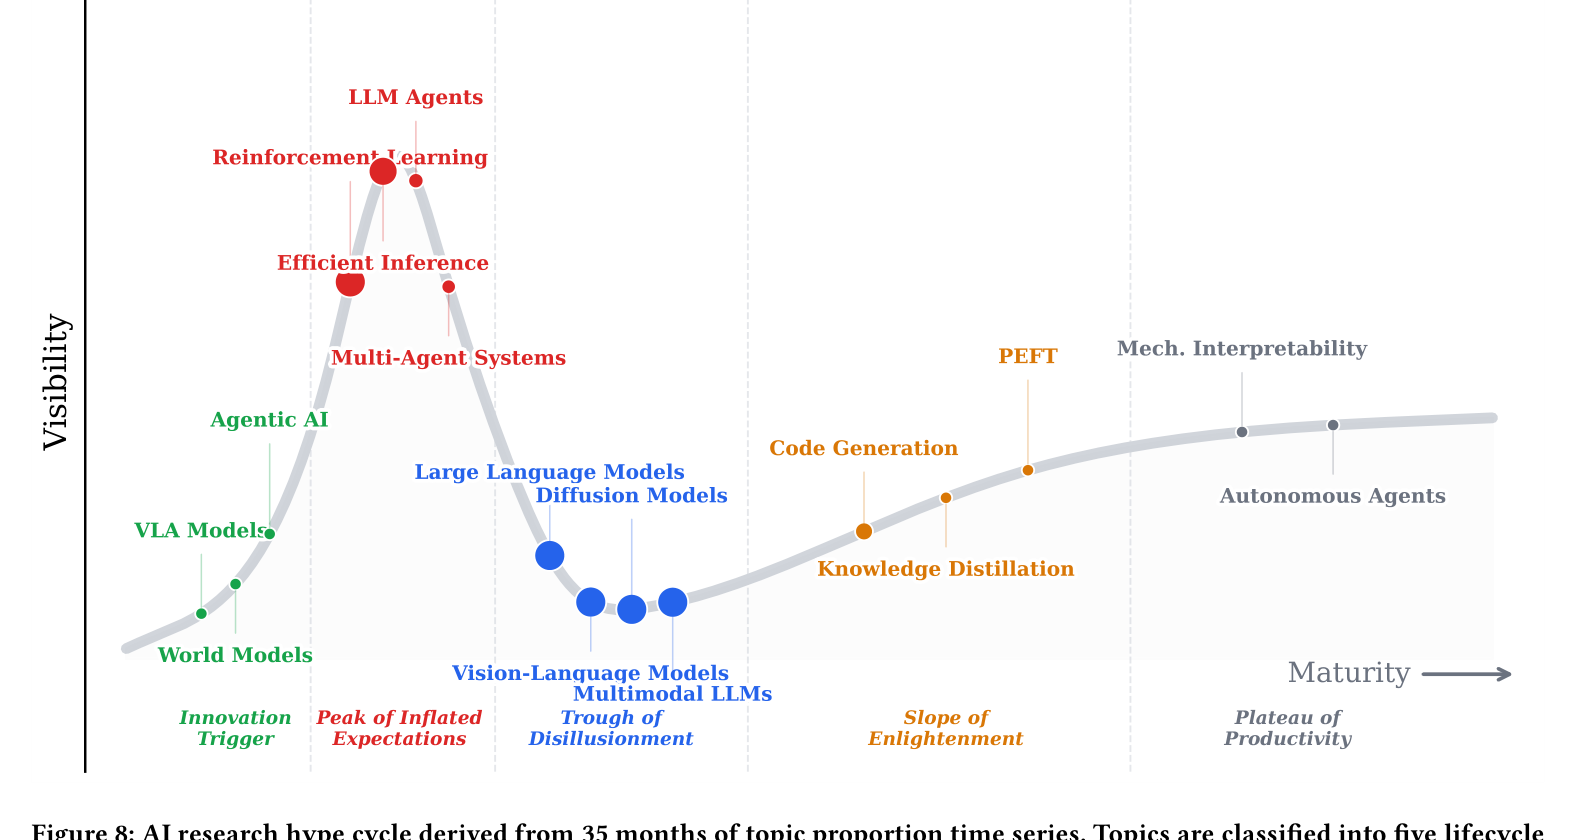
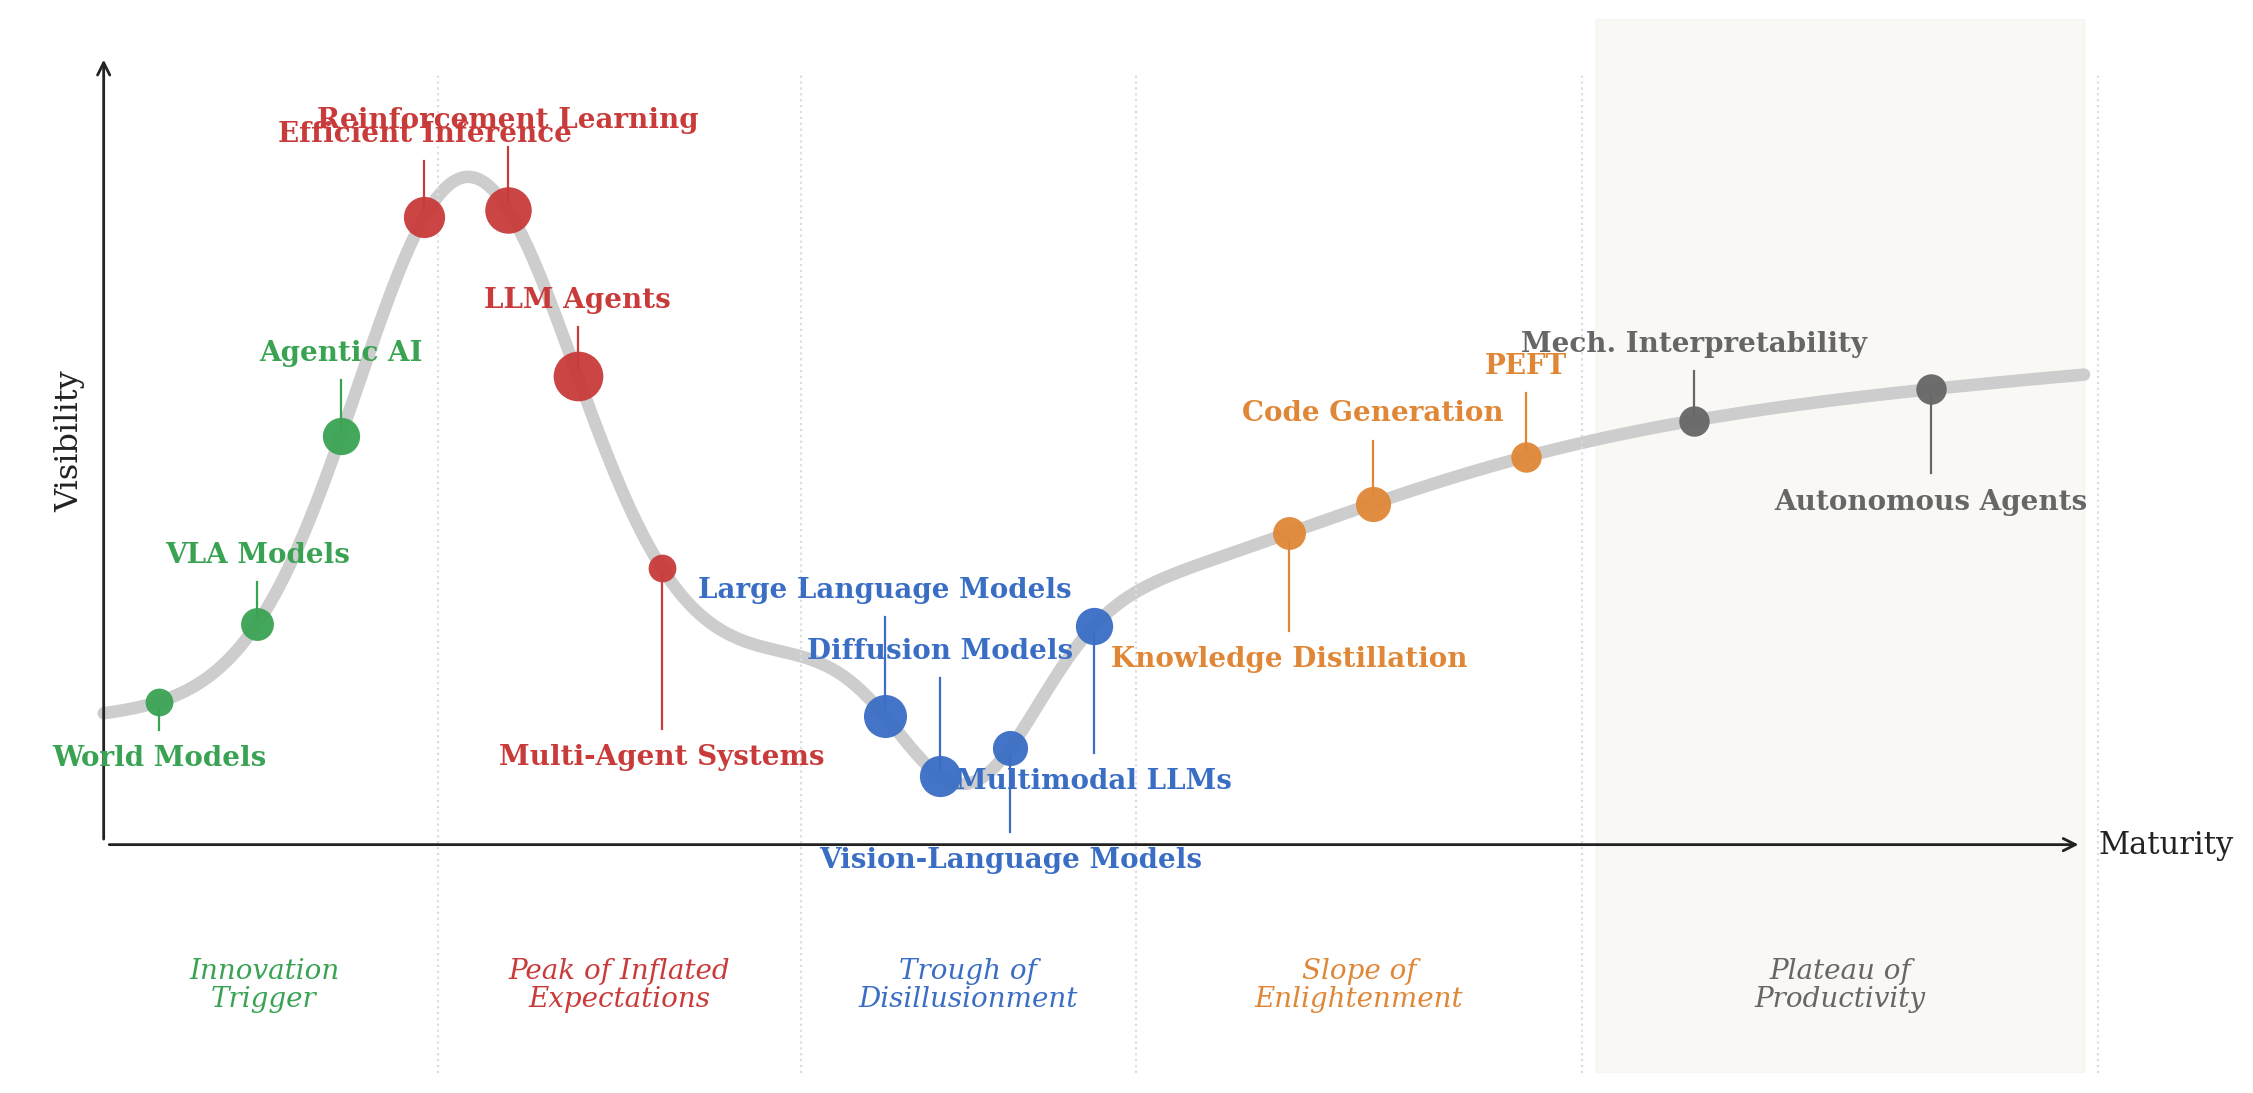
Reproduction of arXiv:2604.04562 Figure 8. A Gartner-style hype-cycle chart derived from 35 months of arXiv topic-proportion time series. The smooth grey curve plots Visibility vs. Maturity; topics are coloured by lifecycle phase (Innovation Trigger / Peak of Inflated Expectations / Trough of Disillusionment / Slope of Enlightenment / Plateau of Productivity). Dot size encodes total paper count; thin leader lines anchor topic labels to dots; arrow-tipped axes and italic phase names sit beneath the curve.
arXiv:2604.04562 Figure 8 复现。基于 35 个月 arXiv 话题比例时间序列绘制的 Gartner 风格 Hype Cycle:浅灰平滑曲线表示 Visibility 随 Maturity 变化,话题按生命周期阶段染色(Innovation Trigger / Peak of Inflated Expectations / Trough of Disillusionment / Slope of Enlightenment / Plateau of Productivity)。点大小编码论文总数,引线连话题文字与点,下方为带箭头坐标轴与斜体阶段名。
@paper · 来自论文
Paper Espresso: From Paper Overload to Research Insight
Paper Espresso:从论文过载到研究洞见
Du et al. (Paper Espresso Authors) · arXiv 2026
"""Reproduction of Paper-Espresso Figure 8 (AI research hype cycle).

Anonymised reproduction of arXiv:2604.04562 Figure 8:
A Gartner-style hype-cycle plot derived from 35 months of arXiv topic-
proportion time series. The smooth grey curve represents Visibility as a
function of Maturity, with topics scattered along the curve coloured by
lifecycle phase (green / red / blue / orange / grey for Innovation Trigger,
Peak of Inflated Expectations, Trough of Disillusionment, Slope of
Enlightenment, Plateau of Productivity). Phase names are italicised
along the bottom; topic labels are pinned with thin leader lines.

Dot size is proportional to total paper count. All coordinates are
inline.
"""

import numpy as np
import matplotlib.pyplot as plt

plt.rcParams.update({
    "font.family": "serif",
    "font.size": 11,
    "axes.linewidth": 1.0,
})

def hype_curve(t):
    rise = 1.45 * np.exp(-((t - 1.6) ** 2) / (0.55 ** 2))
    trough = -0.45 * np.exp(-((t - 3.4) ** 2) / (0.35 ** 2))
    plateau = 0.55 * (1.0 / (1.0 + np.exp(-1.6 * (t - 4.6))))
    base = 0.05 + 0.06 * t
    return rise + trough + plateau + base

T = np.linspace(0.3, 7.4, 800)
Y = hype_curve(T)

PHASES = [
    ("Innovation\nTrigger",          0.30, 1.45, "#3aa353"),
    ("Peak of Inflated\nExpectations",1.55, 2.75, "#c93b3b"),
    ("Trough of\nDisillusionment",    2.85, 3.95, "#3a6dc4"),
    ("Slope of\nEnlightenment",       4.05, 5.55, "#e08737"),
    ("Plateau of\nProductivity",      5.65, 7.40, "#666666"),
]
TOPICS = [
    ("World Models",            0.5,  -0.07, 5,  "#3aa353", -0.12),
    ("VLA Models",              0.85,  0.04, 7,  "#3aa353",  0.16),
    ("Agentic AI",              1.15,  0.22, 9,  "#3aa353",  0.20),
    ("Efficient Inference",     1.45,  1.05, 11, "#c93b3b",  0.20),
    ("Reinforcement Learning",  1.75,  1.42, 14, "#c93b3b",  0.22),
    ("LLM Agents",              2.00,  1.50, 16, "#c93b3b",  0.18),
    ("Multi-Agent Systems",     2.30,  0.90, 5,  "#c93b3b", -0.50),
    ("Large Language Models",   3.10,  0.45, 12, "#3a6dc4",  0.32),
    ("Diffusion Models",        3.30,  0.25, 11, "#3a6dc4",  0.32),
    ("Vision-Language Models",  3.55, -0.15, 8,  "#3a6dc4", -0.28),
    ("Multimodal LLMs",         3.85, -0.05, 9,  "#3a6dc4", -0.40),
    ("Knowledge Distillation",  4.55,  0.42, 7,  "#e08737", -0.32),
    ("Code Generation",         4.85,  0.65, 8,  "#e08737",  0.22),
    ("PEFT",                    5.40,  0.97, 6,  "#e08737",  0.22),
    ("Mech. Interpretability",  6.00,  1.05, 6,  "#666666",  0.18),
    ("Autonomous Agents",       6.85,  1.05, 6,  "#666666", -0.28),
]

fig, ax = plt.subplots(figsize=(11.5, 5.6))

ax.plot(T, Y, color="#cdcdcd", linewidth=4.5, solid_capstyle="round", zorder=1)

ax.axvspan(5.65, 7.40, ymin=0.0, ymax=1.0, color="#f5f3ee", alpha=0.55, zorder=0)
for name, x0, x1, color in PHASES:
    if x1 > 7.4:
        x1 = 7.4
    cx = (x0 + x1) / 2
    ax.text(cx, -0.62, name, ha="center", va="top",
            fontsize=10.0, style="italic", color=color, linespacing=1.05)
    ax.axvline(x1 + 0.05, ymax=0.95, color="#dddddd", linestyle=":", linewidth=0.8)

for label, tx, dy, size, col, label_dy in TOPICS:
    yc = hype_curve(np.array([tx]))[0]
    ax.scatter([tx], [yc], s=20 * size, color=col,
               edgecolor=col, linewidth=0.0, zorder=4, alpha=0.95)
    ly = yc + label_dy
    if label_dy > 0:
        ax.plot([tx, tx], [yc + 0.02, ly - 0.04], color=col,
                linewidth=0.8, zorder=3)
    else:
        ax.plot([tx, tx], [yc - 0.02, ly + 0.04], color=col,
                linewidth=0.8, zorder=3)
    ax.text(tx, ly, label, ha="center",
            va="bottom" if label_dy > 0 else "top",
            fontsize=10.0, fontweight="bold", color=col)

ax.annotate("", xy=(7.4, -0.30), xytext=(0.3, -0.30),
            arrowprops=dict(arrowstyle="->", color="#222", lw=1.0),
            zorder=2)
ax.text(7.45, -0.30, "Maturity", ha="left", va="center",
        fontsize=11, color="#222")
ax.annotate("", xy=(0.3, 1.95), xytext=(0.3, -0.30),
            arrowprops=dict(arrowstyle="->", color="#222", lw=1.0),
            zorder=2)
ax.text(0.18, 0.85, "Visibility", ha="center", va="center",
        fontsize=11.5, color="#222", rotation=90)

ax.set_xlim(0.0, 7.85)
ax.set_ylim(-0.95, 2.05)
for s in ["top", "right", "bottom", "left"]:
    ax.spines[s].set_visible(False)
ax.set_xticks([])
ax.set_yticks([])

plt.tight_layout()
plt.savefig("paperespresso_hype_repro.png", dpi=200, bbox_inches="tight")
print("saved paperespresso_hype_repro.png")