Bar Chart · 柱状图#grouped-bars#hatch-fill#latex#open-spine
SPICE · Grouped bars with white hatch on the main method
SPICE · 分组柱 + 主方法斜线填充
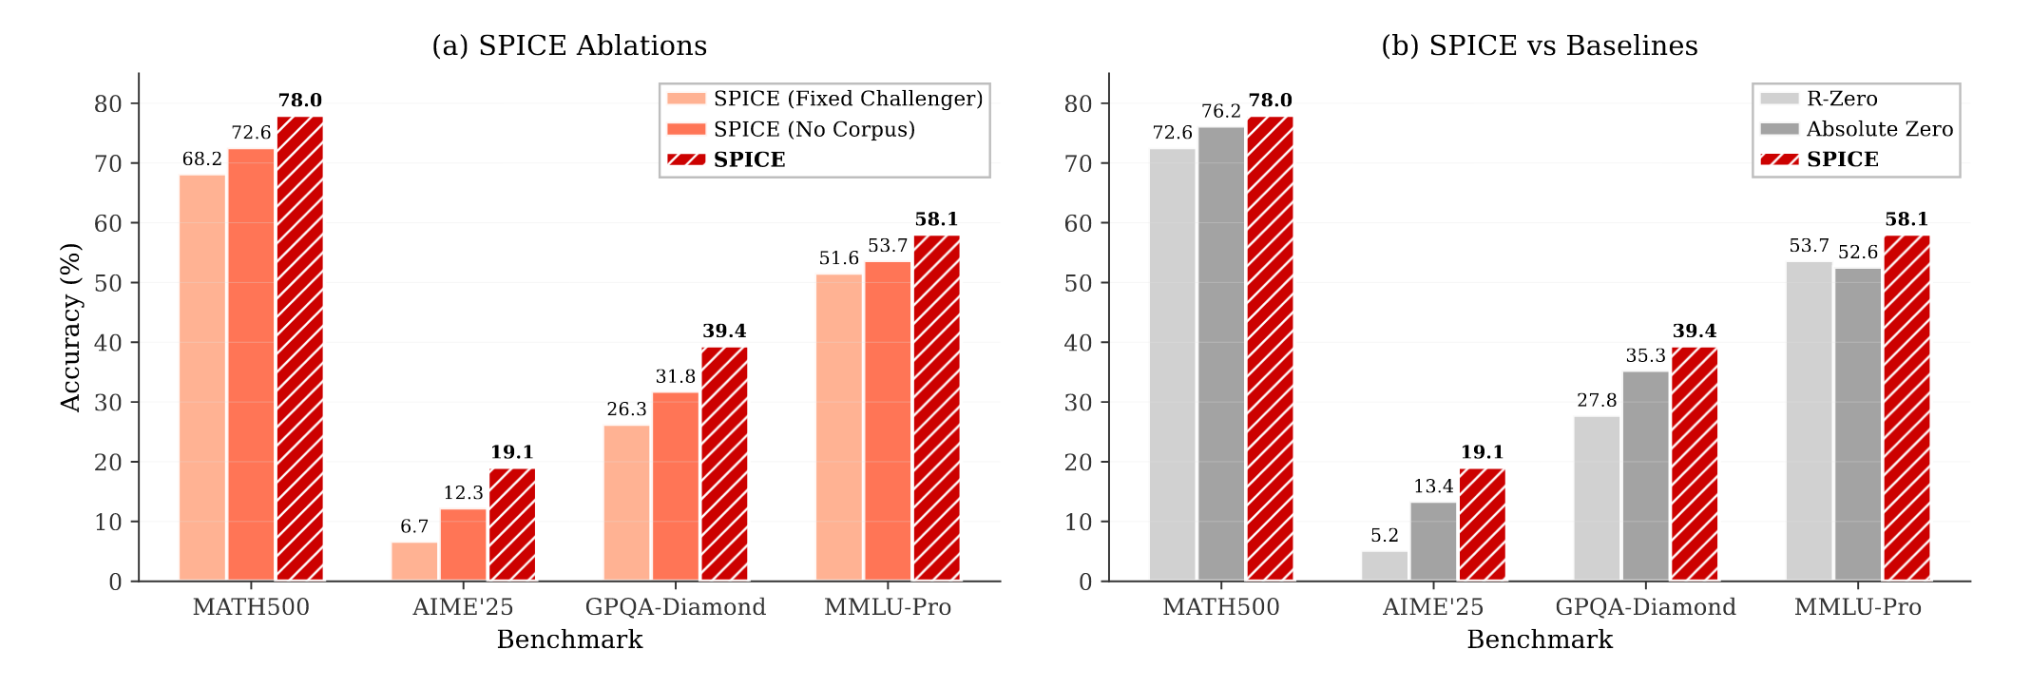
Grouped 3-bar comparison across MATH500 / AIME'25 / GPQA-Diamond / MMLU-Pro. The proposed method is a deep-red bar with white diagonal hatching; bar-top numbers are bold for the winning method, regular for the others. LaTeX Computer Modern serif, open L-shape spines, dashed light grid.
在 MATH500 / AIME'25 / GPQA-Diamond / MMLU-Pro 上对比三种方法:主方法用深红 + 白色斜线填充;柱顶数值在最优方法处加粗。LaTeX Computer Modern serif,开口式 L 形 spine,浅灰虚线网格。
@paper · 来自论文
SPICE: Self-Play in Corpus Environments Improves Reasoning
SPICE:基于语料环境的自博弈推理增强
Meta AI & National University of Singapore · arXiv 2025
// original from paper · 论文原图
// reproduced via bar_spice.py · 脚本复现download png
bar_spice.py
"""
复现 image5: SPICE 论文风格柱状图
特征:分组柱 + 斜线填充(主方法)+ 柱顶数值标注(最优加粗)+ 灰色网格
来源:SPICE: Self-play in corpus environments improves reasoning
"""

import matplotlib.pyplot as plt
import matplotlib.patches as mpatches
import numpy as np

# ── 预分析结论 ─────────────────────────────────────────────
# 字体:原图更接近 LaTeX/Computer Modern,而不是 Times
#       这里直接启用 usetex,优先还原论文图常见的 TeX 字体气质
# 加粗:面板标题(normal) | 图例 SPICE 条目(bold) | 其他图例(normal)
#       主方法数值(bold+深红) | 其他数值(normal+黑)
# 间距:三柱较细,组间留白明显,子图整体更扁,接近原图长宽比
# 边框:四边框都保留,且柱子层级低于边框
# 分辨率:300 dpi
plt.rcParams.update({
    'text.usetex': True,
    'font.family': 'serif',
    'font.serif': ['Computer Modern Roman', 'STIX Two Text', 'DejaVu Serif'],
    'axes.unicode_minus': False,
    'hatch.color': 'white',     # 原图是白色斜线刻在红底上
    'hatch.linewidth': 1.4,
})

# ── 颜色 & 填充 ───────────────────────────────────────────
# 左图 (ablation)
COLORS_ABL   = ['#FFB695', '#FF7F5E', '#D00000']   # 浅橙/中橙/正红(对齐原图)
HATCHES_ABL  = ['', '', '//']
LABELS_ABL   = ['SPICE (Fixed Challenger)', 'SPICE (No Corpus)', 'SPICE']

# 右图 (comparison)
COLORS_CMP   = ['#D3D3D3', '#A9A9A9', '#D00000']   # 浅灰/中灰/正红(对齐原图)
HATCHES_CMP  = ['', '', '//']
LABELS_CMP   = ['R-Zero', 'Absolute Zero', 'SPICE']

# ── 数据 ─────────────────────────────────────────────────
benchmarks = ['MATH500', "AIME'25", 'GPQA-Diamond', 'MMLU-Pro']

data_abl = {
    'SPICE (Fixed Challenger)': [68.2,  6.7, 26.3, 51.6],
    'SPICE (No Corpus)':        [72.6, 12.3, 31.8, 53.7],
    'SPICE':                    [78.0, 19.1, 39.4, 58.1],
}
data_cmp = {
    'R-Zero':        [72.6,  5.2, 27.8, 53.7],
    'Absolute Zero': [76.2, 13.4, 35.3, 52.6],
    'SPICE':         [78.0, 19.1, 39.4, 58.1],
}

BEST_METHOD = 'SPICE'   # 柱顶数字加粗的方法


def draw_panel(
    ax,
    data_dict,
    colors,
    hatches,
    labels,
    title,
    x_positions,
    total_w,
    xlim,
    legend_anchor,
):
    n_groups  = len(benchmarks)
    n_methods = len(labels)
    x         = np.array(x_positions)
    bar_w     = total_w / n_methods

    for i, (label, color, hatch) in enumerate(zip(labels, colors, hatches)):
        vals   = data_dict[label]
        offset = (i - n_methods / 2 + 0.5) * bar_w
        bars   = ax.bar(x + offset, vals, width=bar_w,
                        color=color, hatch=hatch,
                        edgecolor='white',
                        linewidth=0.8, zorder=2, label=label)

        is_best = (label == BEST_METHOD)
        for bar, v in zip(bars, vals):
            ax.text(bar.get_x() + bar.get_width() / 2,
                    v + 0.5, f'{v}',
                    ha='center', va='bottom',
                    fontsize=8.7,
                    fontweight='bold' if is_best else 'normal',
                    color='black',   # 原图数值全部黑色,仅粗细区分
                    zorder=3)

    # 轴
    ax.set_xticks(x)
    ax.set_xticklabels(benchmarks, fontsize=10.8)
    ax.set_xlabel('Benchmark', fontsize=11.2)
    ax.set_ylabel(r'Accuracy (\%)', fontsize=11.2)
    ax.set_ylim(0, 85)
    ax.set_xlim(*xlim)
    ax.set_title(title, fontsize=13.2, pad=5)

    # 网格(仅 y 轴浅灰实线)
    ax.yaxis.grid(True, color='#EBEBEB', linewidth=0.7, linestyle='--', zorder=0)
    ax.set_axisbelow(True)

    # 原图为开口式坐标轴:只保留左/下 spine
    for side, spine in ax.spines.items():
        if side in ('top', 'right'):
            spine.set_visible(False)
        else:
            spine.set_linewidth(0.9)
            spine.set_color('#333333')
            spine.set_zorder(4)

    ax.tick_params(length=0, labelsize=10.2)

    # 图例
    handles = [mpatches.Patch(facecolor=c, hatch=h,
                               edgecolor='white', linewidth=0.8,
                               label=l)
               for l, c, h in zip(labels, colors, hatches)]
    leg = ax.legend(handles=handles, fontsize=8.9, loc='upper right',
                    bbox_to_anchor=legend_anchor,
                    framealpha=1.0, facecolor='white',
                    edgecolor='#C8C8C8', fancybox=False,
                    borderpad=0.28, labelspacing=0.26,
                    handlelength=1.7, handletextpad=0.45,
                    borderaxespad=0.28)
    # 只将主方法(BEST_METHOD)的图例文字加粗
    for text in leg.get_texts():
        if text.get_text() == BEST_METHOD:
            text.set_fontweight('bold')


# ── 画布 ─────────────────────────────────────────────────
fig, (ax1, ax2) = plt.subplots(1, 2, figsize=(12.8, 4.35))
fig.subplots_adjust(left=0.05, right=0.985, bottom=0.15, top=0.86, wspace=0.16)

draw_panel(
    ax1,
    data_abl,
    COLORS_ABL,
    HATCHES_ABL,
    LABELS_ABL,
    '(a) SPICE Ablations',
    x_positions=[0.00, 1.00, 2.00, 3.00],
    total_w=0.78,
    xlim=(-0.56, 3.56),
    legend_anchor=(0.992, 0.986),
)
draw_panel(
    ax2,
    data_cmp,
    COLORS_CMP,
    HATCHES_CMP,
    LABELS_CMP,
    '(b) SPICE vs Baselines',
    x_positions=[0.00, 1.00, 2.00, 3.00],
    total_w=0.78,
    xlim=(-0.56, 3.56),
    legend_anchor=(0.992, 0.986),
)

plt.savefig('bar_spice_repro.png',
            dpi=300, facecolor='white')
plt.close()
print('saved: bar_spice_repro.png')